There are only six metrics you need to track as a product-led business.
These six will tell you exactly where users get stuck in their journey so you can quickly pinpoint the #1 bottleneck in your business.
Without monitoring these metrics, you’re simply guessing where to focus.
And that can be costly.
In one of my last 1:1 coaching sessions, a large public company told me they spent two years and an entire 200+ R&D team focusing on the wrong bottleneck. They literally spent millions of dollars fixing the symptom, not the root issue!
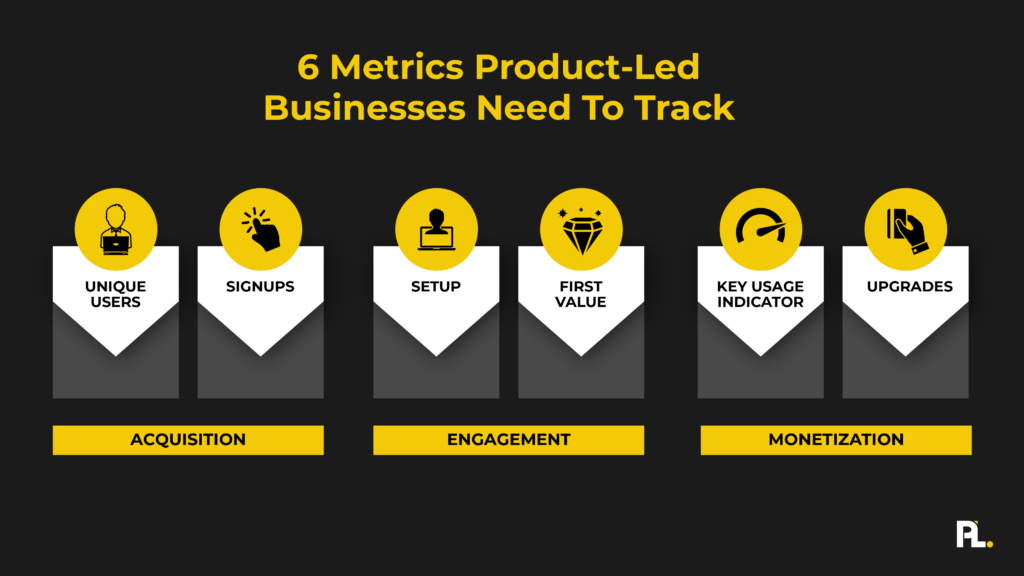
I don't want that to happen to you. By monitoring six metrics, you're going to have clarity about where you should focus in the business. They cover every stage of the customer lifecycle – acquire, engage, monetize – in a product-led business.
Why only these six metrics?
We’ve found that most product-led companies overcomplicate data. They’re tracking too much, and as a result, there is no accountability.
We know because we also made this mistake too.
The first time we set up our Company Scorecard at ProductLed, it was a Google Sheet with a bunch of metrics… 36 metrics, to be exact. And each metric had someone listed who was accountable for that metric. Since we were a small team, some people were responsible for five to eight metrics each.
This simple oversight of tracking too many things meant that our team didn’t know where to focus, and we made little meaningful progress on any of the metrics since our attention was spread thin.
So now that you understand why these six metrics matter, let’s take a look at what you need to track:
- Visit: an anonymous, unique user finds your website.
- Signup: a user signs up for your product.
- Setup: a user completes the onboarding process for your product.
- First Value: a user experiences tangible value in your product.
- Key Usage Indicator: a user hits a key usage indicator (KUI) in the product that indicates they’ve seen enough value in the product to upgrade (i.e., time limit, feature limit, usage limit, etc.).
- Upgrade: a user successfully upgrades and pays for your product.
Half of these metrics are pretty straightforward. For instance, a visit, signup, and upgrade are simple to understand and monitor.
But the remaining three might feel a bit murky, so let’s define those.
Setup
For the Setup metric, we will say the endpoint is once they’ve completed your onboarding process and have done everything they need to set up their account. This could be as simple as answering a few questions to personalize your account experience or be as complex as uploading a piece of JavaScript on their website.
It’s important to pick an ending for your setup stage that isn’t complicated but sets users up for success.
For many of you, this could be as simple as completing the onboarding process.
First Strike
The first strike metric is once a user has experienced some tangible value in the product.
For instance, if you’re a time-tracking software solution, the first strike could be getting five people on your team to start consistently using time tracking. Full value realization would be rolling out time tracking for the entire company.
I want to emphasize an important distinction…
First strike = tangible value.
The first strike does not equal the full value realization of the product.
This means they are able to do or experience something they weren’t able to do before. For instance, after using Canva for 5 minutes, I could create designs I never thought were possible with my lack of design skills. Yet, I don’t have access to all the bells and whistles in the product yet.
Now, your job is to identify your product's first value. Don’t overcomplicate it. Just pick something that you feel is directionally correct and start measuring it.
Note: It’s important to note that this metric has many other terms: aha moment, first strike, etc. They all refer to the same moment: when the user realizes the value of a product.
Key Usage Indicator
Key usage indicators (KUI) let us know that a user has received sufficient value in the product to make a purchasing decision. It’s at this point that a user becomes qualified to upgrade. With that said, users can upgrade before or after the key usage indicator.
Here are a few examples of KUIs from well-known brands:
- For Slack, it's when an account reaches its 2,000 message limit.
- For Facebook, it's once someone adds seven friends.
- For Drift, it's once someone has 100 conversations on their website.
Be careful not to choose something like Weekly Active Users for this metric. A few students on our last coaching call chose this, and I challenged them on it. For some businesses, it could work. But normally it doesn't tell you if people are experiencing the value of your product.
At this stage, it’s okay for your KUI to feel like you guessed a bit when it comes to defining it.
However, you’ll validate this with data later. If you’ve chosen the right KUI, you should see a high likelihood that these users will become paying customers. A KUI is nothing more than a great leading indicator for identifying who is getting meaningful value from your product.
Putting it all together
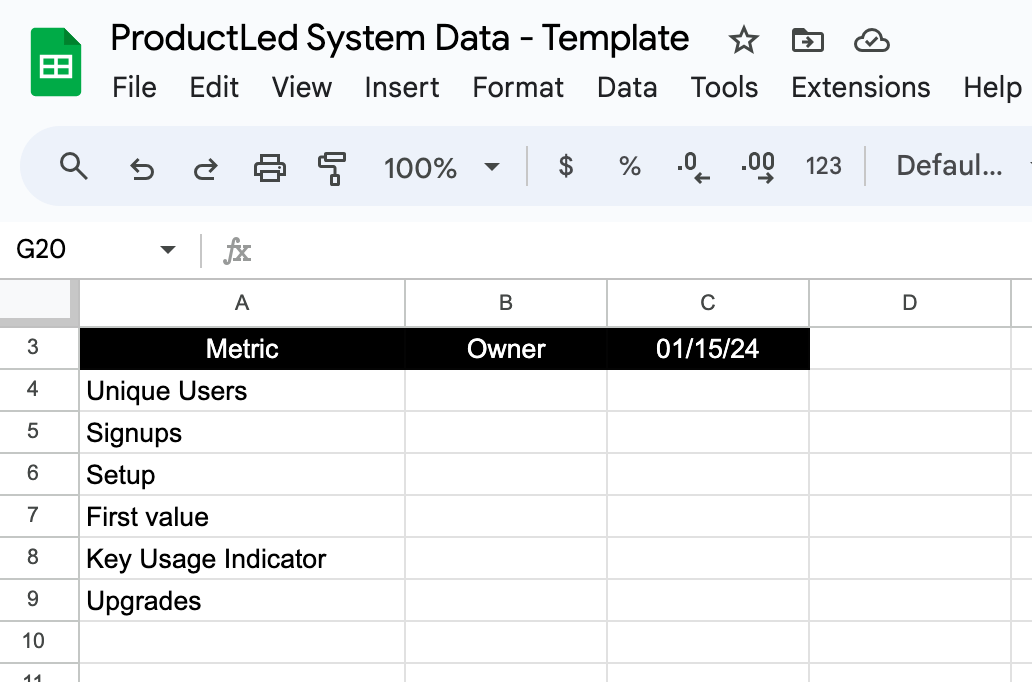
Once you’ve chosen your six metrics, take the time to create a simple spreadsheet. Here’s a template you can use. It’ll look something like this:
Monitor these metrics every week, and within a couple of weeks, you’ll begin to see what the main bottleneck is in your business.
For instance, can you identify the biggest bottleneck for this business in the image below in less than 10 seconds?
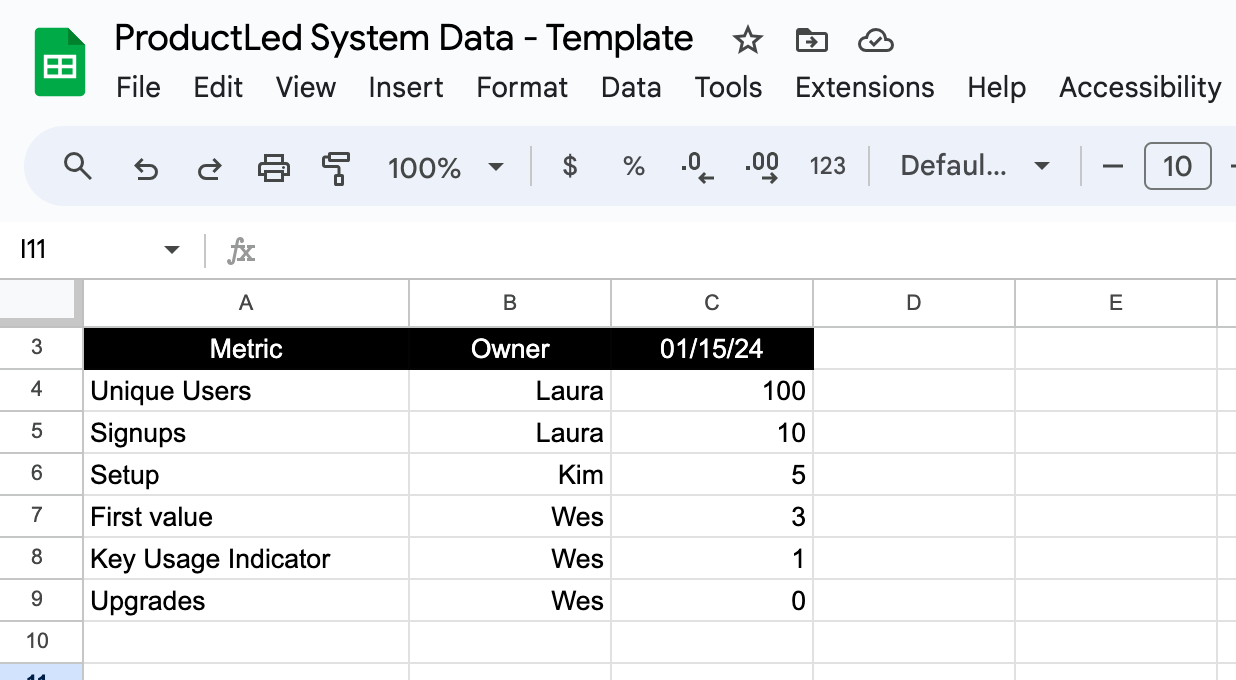
If you guessed it's users who don’t complete setup, you’re right! You can 2x this business by focusing on improving the setup/onboarding process.
Then imagine if your entire team focused all their time on launching experiments to solve this one bottleneck. Would you grow faster?
Most likely.
And then you won’t spend two years of your time and millions of dollars fixing the wrong problem.
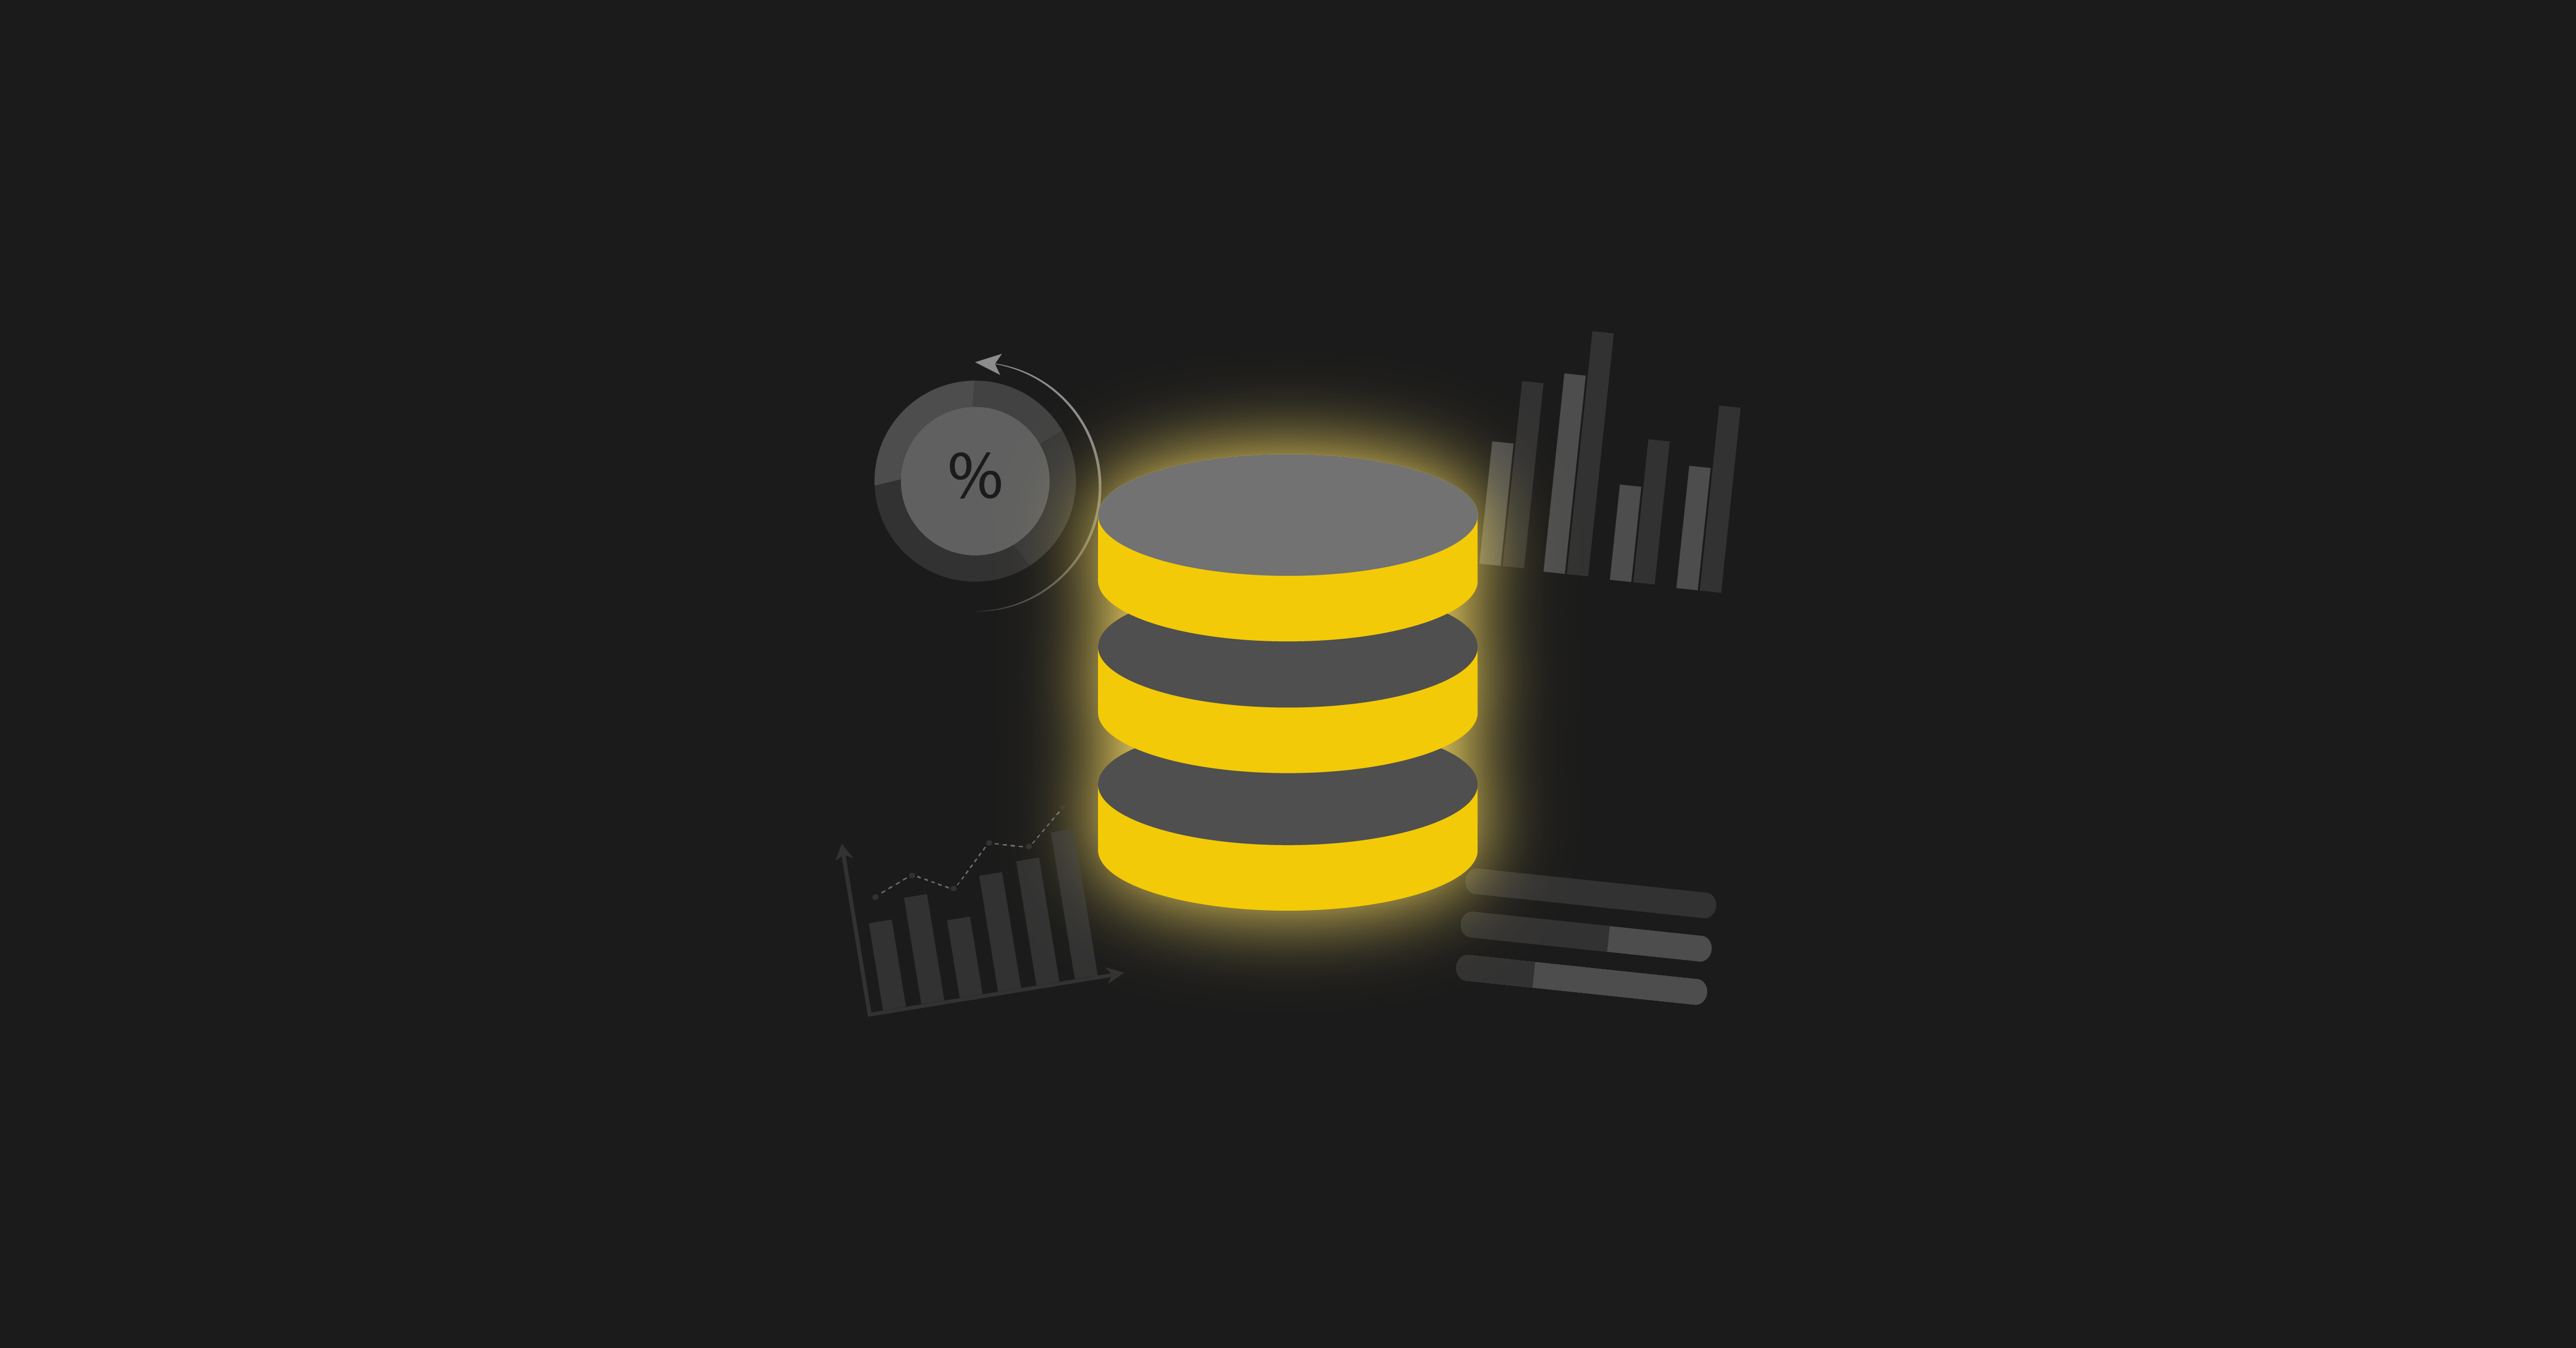
Rounding out your data.
There’s more to data than just metrics. Financials and product usage are just as critical as customer insights—which is why data is a core component of the ProductLed System™️.
If you're unsure whether your team has the right foundations in place, start by taking the PLG Readiness Assessment. It’s a quick way to evaluate how well your business is set up to make data-driven decisions that lead to growth.
Already have a sense of what needs work? You can schedule a strategy session to explore how to round out your data strategy and implement the rest of the ProductLed System™️.
And if you want structured guidance, ProductLed Academy is our hands-on coaching program where we help teams like yours build a strong data foundation—so you can scale faster and with more clarity.