
Ten metrics can give you a clear picture of your company’s performance in relation to your growth goals.
This article will show you how to create a company scorecard.
I’ll share what the heck they are, why you need one, and, most importantly, what you need to be tracking.
By the end, you’ll know the next steps you need to take to create one for your company.
And I’ll make it even easier by giving you a simple template to roll one out at your company.
Let’s get started.
What is a company scorecard?
A scorecard is a simple metric tracking tool that gives you a snapshot of your business's overall performance.
It offers a structured and measurable way to assess your business's performance, progress, and success.
Your scorecard template doesn’t have to be complicated. In fact, it should be fairly simple.
I suggest you use a Google Sheet. You can use this scorecard template here.
Here’s what it looks like.
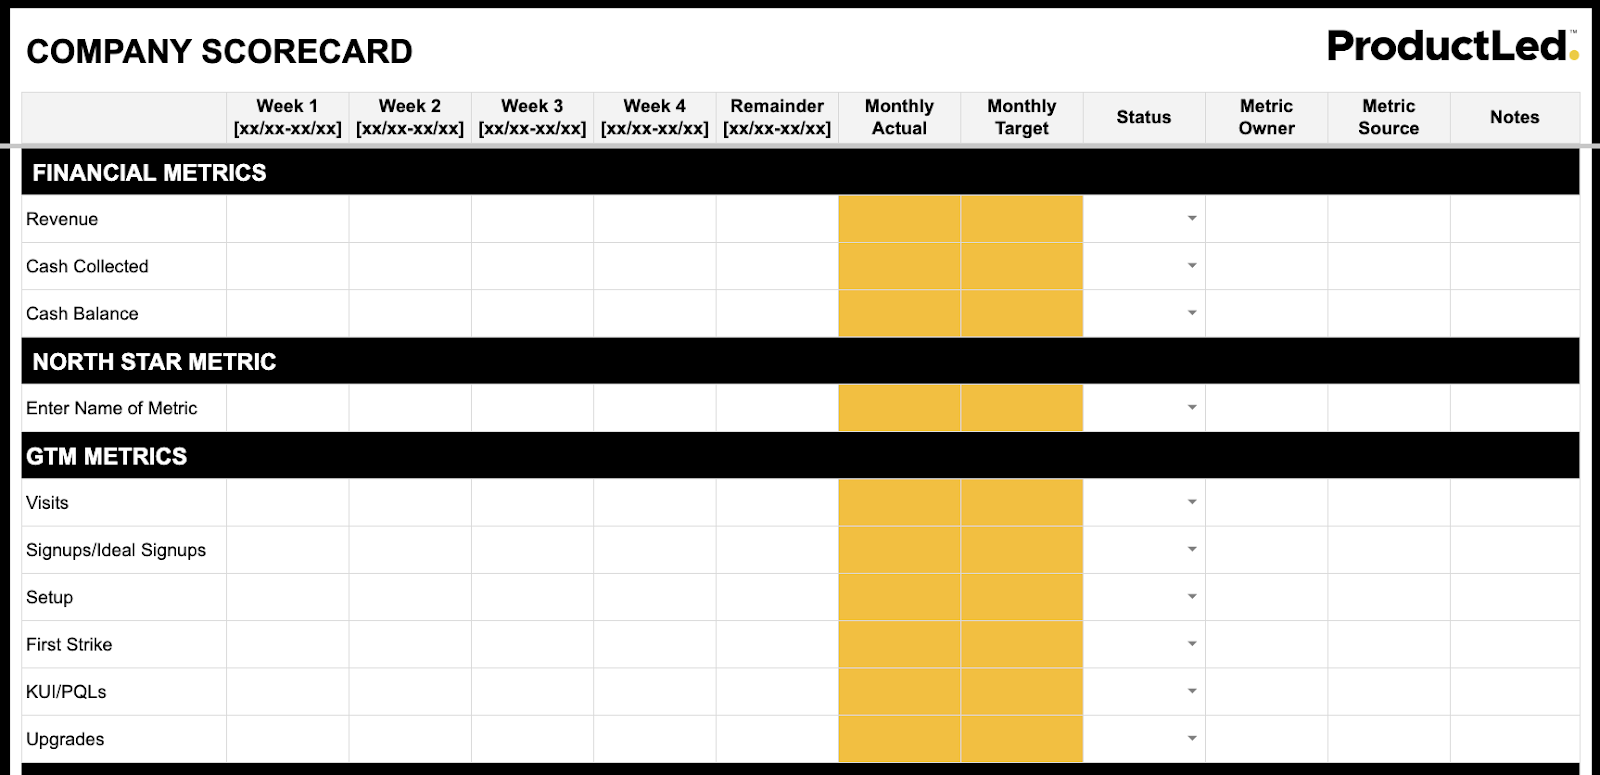
Let’s get into what all of that actually means.
10 Must-have metrics for an effective company scorecard
Your team should start by tracking ten key metrics.
They give you a solid foundation to understand what’s going on in your product-led business and if you're moving in the right direction.
These must-have metrics fall into three main buckets:
- Financial metrics
- North Star Metric
- Go-to-market metrics
Let’s get into the details of each one.
Financial Metric Bucket
These financial metrics are the first three (of ten) you should track on your scorecard. You can ask your bookkeeper to send this to you every week in a simple email.
- Revenue (MRR)
- Cash Flow
- Cash Collected
North Star Metric Bucket
Your North Star Metric (NSM) is a compass for evaluating your product's core value to customers.
For product-led companies, user engagement comes before monetization. That’s because users experience a product’s value during a free trial or freemium plan and then upgrade to a paid subscription.
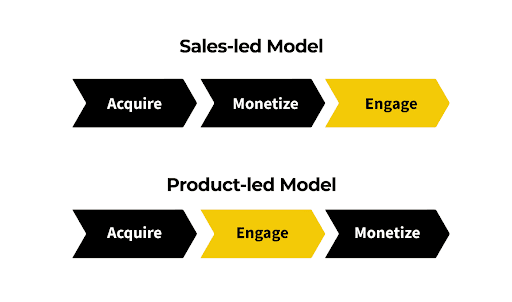
Therefore, a good NSM has nothing to do with revenue in PLG and everything to do with engagement.
Here are a few great examples:
- Zoom tracks the number of hosted meetings per week.
- Intercom tracks the number of customer interactions per week.
- Medium tracks the number of minutes spent reading per week.
To learn more about NSMs, check out how to identify the North Star Metric for your product-led business (& why it matters)
GTM Metrics Bucket
GTM metrics look at how people move through the value funnel of your product-led business — from initial sign-up to first strike to upgrades.
The following six metrics complete the list of ten must-haves on your company scorecard.
Number of visits to your website
This metric zeros in on the number of unique users visiting your website weekly. It offers insight into whether you’re moving in the right direction regardless of whatever channels you use.
Signups
This metric tracks how many users have signed up for your free trial or freemium model.
Keep it simple for now. But if you’re tracking how many signups are your ideal users, you can add that here.
Setup
The setup metric tracks how many people have completed your onboarding process and completed all the tasks required to set up their accounts. Your setup can be simple questions to personalize their account experience or require a complex JavaScript upload to complete sign-up.
Don’t make it too complicated.
Completing the onboarding process is a good setup metric for many product-led companies.
First Strike
The first strike metric is when a user has experienced some core value of your product.
This means a user could do or experience something they couldn’t do before. For instance, you could learn helpful Spanish phrases for an upcoming trip to Mexico after using Duolingo for a few free lessons. Yet, you don’t have access to all the advanced learning materials in the product.
Don’t overcomplicate identifying your product's first value. Pick and track something you feel is directionally correct and start measuring it.
Key Usage Indicator (KUI) or Product Qualified Leads (PQL)
This metric has two options: choose the best one for your company’s scorecard.
KUI metric refers to all the users who have experienced the product's core value multiple times, typically around three.
On the other hand, a PQL focuses on ideal users who have completed the usage indicator, first strike, and setup stages.
If you’re already tracking ideal user signups, you’ll want to track PQLs on your scorecard. Otherwise, track the KUI.
Upgrades
The final GTM metric to track on your scorecard is the number of users who successfully upgrade and pay for your product.
Now that you know what ten metrics you need to track and why, let’s review some elements that make your company scorecard an effective team tool.
How to track your company scorecard metrics [a color-coded approach]
You need widespread company buy-in for scorecard success.
And the best way to align everyone around these metrics is not only to review them every week but have someone accountable for each one.
At ProductLed, we gather for weekly leadership meetings. During these sessions, we check whether the metrics on our scorecard are on or off track and have a color-coded system integrated into our scorecard for clarity.
This helps us understand if we’re meeting our goals or not.
Let's illustrate the color coding of a company scorecard with an example.
How to color-code your company scorecard
This is rather simple but incredibly powerful.
By doing this, you’ll be able to quickly pinpoint the bottleneck in your growth strategy.
Each color on your scorecard represents the current status of the metric.
Let’s break this down with an example.
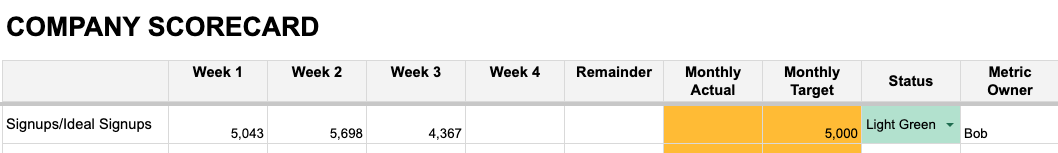
Let’s say Bob is responsible for tracking your company’s ideal signups. The target for this metric is 5,000 visits per week.
In your weekly meeting, you’d ask, "Bob, is this metric on or off track?"
There were only 4,367 ideal signups last week. That’s lower than your target, so Bob would report that the metric is slightly below average to the team.
Therefore, Bob would set mark ideal signups with a light green status.
Pro tips to build your company scorecard
As you gather and add your ten key metrics to your scorecard, here are a few tips to set you up for success.
- As you build your scorecard, backtest it by revisiting the previous month's data.
Filling it in will not only show you the health of your business, but it will also help you identify realistic targets moving forward.
- Once you set your metrics, don’t make immediate changes.
Modifying your scorecard metrics is possible, but I recommend sticking with them for at least a month. It's natural for founders to feel tempted to customize and add more metrics, but I challenge you to keep it simple.
- Get your whole team on the same page.
Determine whether your data tracking follows a Monday-to-Sunday cycle or another schedule, and stick to that cadence for consistent updates.
- Keep it stupid simple.
If your team is under seven members, focus on the three main metric buckets: financial, North Star Metric, and GTM motion.
As your organization grows, you may need to add two to four specific metrics per team to your scorecard.
- Manually review your metrics.
Your scorecard is a high-level overview of what’s going on in your business. When you manually have to go into a tool and look up a metric, this prompts curiosity and encourages your team to dig into the other supporting leading indicator metrics that contribute to those major ones, particularly when it’s not hitting its monthly targets.
Start building a scorecard for your product-led company
The simplicity of this scorecard will help you pinpoint the core bottleneck in your business.
Your company’s scorecard falls under the data component of the ProductLed System™—a nine-part framework designed to help you stay focused and 2x your self-serve revenue in 12 months. When your team is aligned around the right metrics, you’ll be able to prioritize better, run faster experiments, and track real progress toward growth.
Not sure where to start? You can complete the PLG Readiness Assessment to get a clearer picture of where your business stands. And if you're looking for personalized support, schedule a strategy session to explore the best path forward based on your goals.
Alternatively, if you'd rather work with a coach to implement the data component into your business, check out ProductLed Academy. We'll work directly with your leadership team to implement the ProductLed System™ so you can scale faster—with more focus and less stress.
You'll walk away with a fully aligned scorecard and a rhythm for reviewing it so your team stays accountable and dialed in week after week.