
Your North Star Metric (NSM) is your compass for measuring the core value your product delivers to your customers.
When chosen and implemented correctly, every team can contribute towards improving it.
However, it is tricky to pick the right one. And that’s what I’m going to teach you today.
By the end, you'll have a clear understanding of what your NSM might be and how it can supercharge your business.
Let’s get started.
North Star Metrics and your GTM Strategy
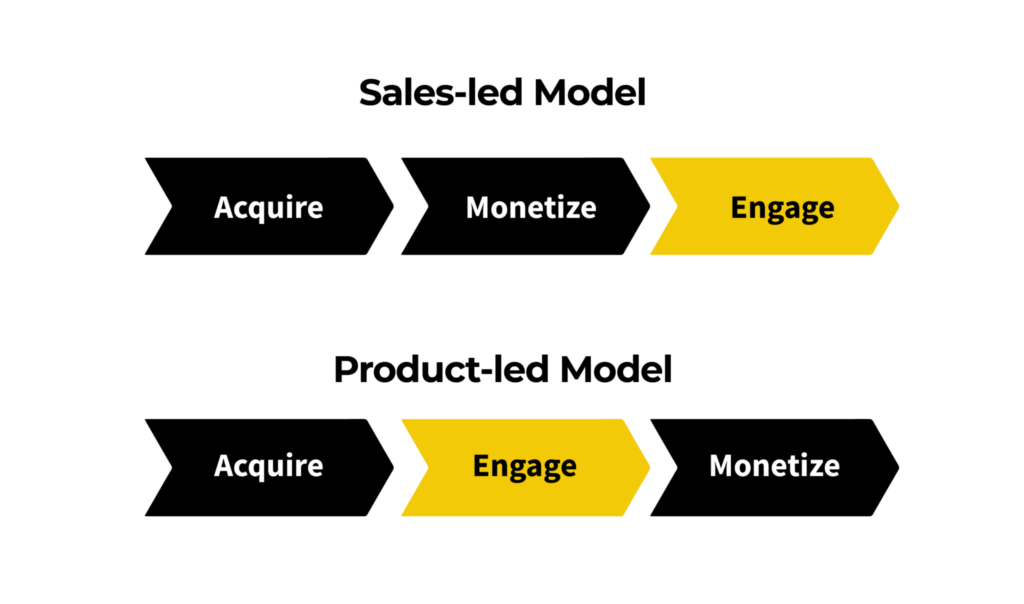
Your NSM is actually a bit different in a product-led setting compared to a traditional sales-led growth approach.
In a sales-led motion, engagement and value delivery come into play only after a user becomes a paying customer.
In contrast, in a product-led approach, engagement is the focus before monetization. Businesses deliver significant value upfront (usually with a free trial or freemium model) before purchasing.
Your NSM will reflect this shift because your NSM relates to the value users receive in the product.
Let’s take a quick look at great NSM examples:
- Intercom: number of customer interactions per week.
- Salesforce: number of records created per account
- Zoom: number of hosted meetings per week
- Medium: number of minutes spent reading a week
What I love about NSMs is they pave the way for growth rooted in genuine value.
And if you choose the right one, you’ll see more users getting to value and it will have a direct result on upgrades.
Now that you know what an NSM is, let’s look into how to identify yours.
What makes a successful North Star Metric?
There are three components that make up an NSM: quantity, quality, and frequency.
Collectively, they provide a comprehensive framework for evaluating user engagement, product value, and optimal user behavior.
Let’s break them down:
1. Quantity Metric
This measures the frequency of user interactions and gives a good indication of user engagement with your core product or service.
The quantity metric should:
- Be easy to measure.
- Correlate with user success.
- Reflect the behavior of ideal customers.
2. Quality Indicator
The quality metric of a NSM assesses the degree to which users engage in a specific core behavior, which indicates the value derived from the product or service.
The quality metric should:
- Directly tied to the product's core value.
- Indicate success and user satisfaction.
3. Frequency
The frequency metric of a NSM determines the regularity or cadence at which users engage in a specific core behavior, providing insight into the regular and predictable pattern of users.
The frequency should:
- Align with the natural cadence of user behavior.
- Be directly tied to how often a user experiences value.
These three components create a holistic and well-rounded NSM framework.
Examples of North Star Metrics
As you start brainstorming your own North Star metric, it’s helpful to have examples of what to do and what not to do.
Good North Star Metrics
Zoom
NSM: The number of hosted meetings per week.
- Quantity metric: Total number of hosted meetings, which gives insight into the product's core value.
- Quality metric: It directly reflects the core value of Zoom, which is to facilitate seamless and efficient meetings.
- Frequency: The weekly measurement aligns with the typical cadence of work-related activities, providing a relevant and timely assessment.
Medium
NSM: The number of minutes spent reading per week.
- Quantity metric: This metric tracks the total time users spend reading on the Medium platform, indicating their engagement with the content.
- Quality metric: It aligns with Medium's core value of providing valuable written content and suggests that users find the platform's articles meaningful.
- Frequency: It considers users' reading habits weekly and offers a regular assessment of engagement.
Intercom
NSM: The number of customer interactions per week.
- Quantity metric: This metric captures the total interactions on the Intercom platform, highlighting the frequency and depth of customer engagement.
- Quality metric: It is directly tied to Intercom's value proposition of facilitating effective communication with customers.
- Frequency: The weekly measurement aligns with the ongoing nature of customer interactions, providing a consistent evaluation of engagement.
Bad North Star Metrics
Two of the most common bad NSMs I see are:
- Number of signups
- Website Visitors
The main reason these two don’t work is because they aren’t tied to the core value of the product.
Another reason is because it’s not tied to every team in your organization. For instance, can the product team really help improve the number of website visitors? Not really.
How to Involve Your Team
You’ll know you’ve chosen a good NSM when every team can work towards improving it.
One of the most powerful activities you can do is to brainstorm ways each team can improve the metric.
You can use this template to get started.
Here’s what it might look like:
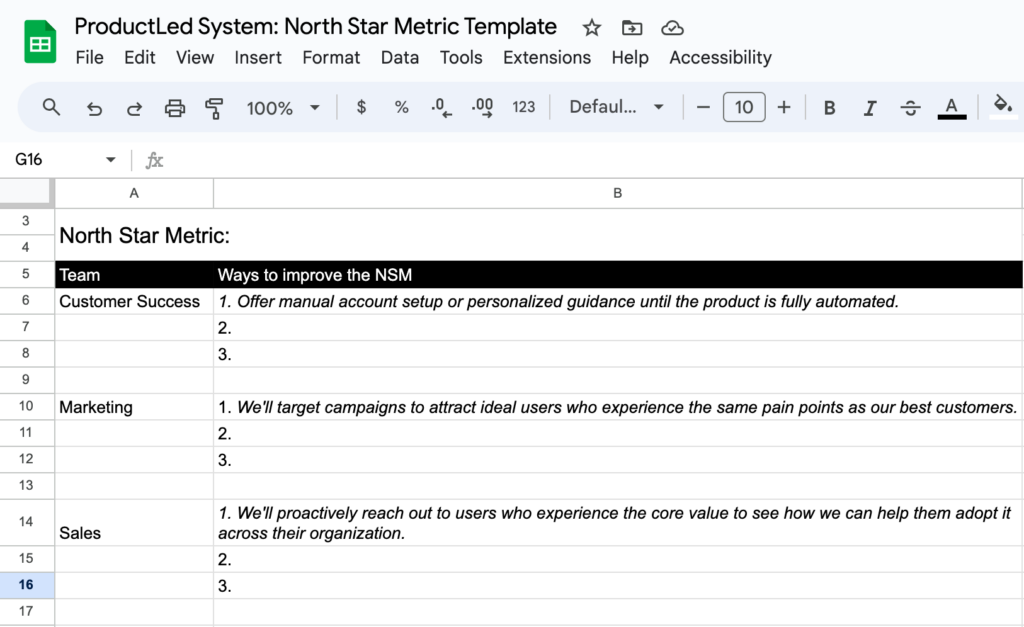
This collaborative effort is powerful because everyone is rowing in the same direction.
The key is simplicity
Don't overcomplicate the process.
Select one NSM and start tracking it.
Remember, your NSM is simply a tool to monitor and ensure your business progresses in delivering meaningful value.
Your user’s success becomes your success.
Don’t forget that.
Need Help Identifying North Star Metric?
Your North Star Metric (NSM) sits at the heart of the data component in the ProductLed System™️—a holistic go-to-market framework built around the nine essential components of product-led success.
If you're not sure where to start or want to assess how well your business is set up to make data-driven decisions, take the PLG Readiness Assessment. It’ll help you evaluate whether the right data, metrics, and alignment are already in place—or if you need to refine your approach.
Once you have a clearer picture, you can schedule a strategy session to explore how to bring your North Star Metric to life across teams and workflows.
You can also go deeper on your own by reading this guide to building a data-led organization. It walks through how to operationalize your NSM and drive alignment at every level.
Or, if you'd rather have a coach walk you through the process, ProductLed Academy offers hands-on support to help your leadership team identify, validate, and act on your most important growth metric—so you can scale faster, with more clarity and less chaos.