While onboarding is huge for retention, nurturing customers to adopt and love your product doesn’t stop after they’re in your ecosystem. Growing and retaining a user base is about minimizing user friction throughout their journey and gathering data that helps you achieve that goal.
Product-led growth (PLG) metrics are critical to reaching and exceeding your growth and retention-related goals. Without them, you face a major (and common problem): insufficient data to make informed decisions.
So, how do we use PLG metrics to improve our customer acquisition and retention? First, we need to understand the framework these metrics sit within.
The Product-Led Growth Flywheel
The flywheel is also known as the marketing flywheel. It’s a framework for thinking strategically about the lifecycle of every product user and exceeding their expectations at each stage of their journey.
With the help of flywheel metrics, it's easier to map out the next steps and improve the overall customer experience.
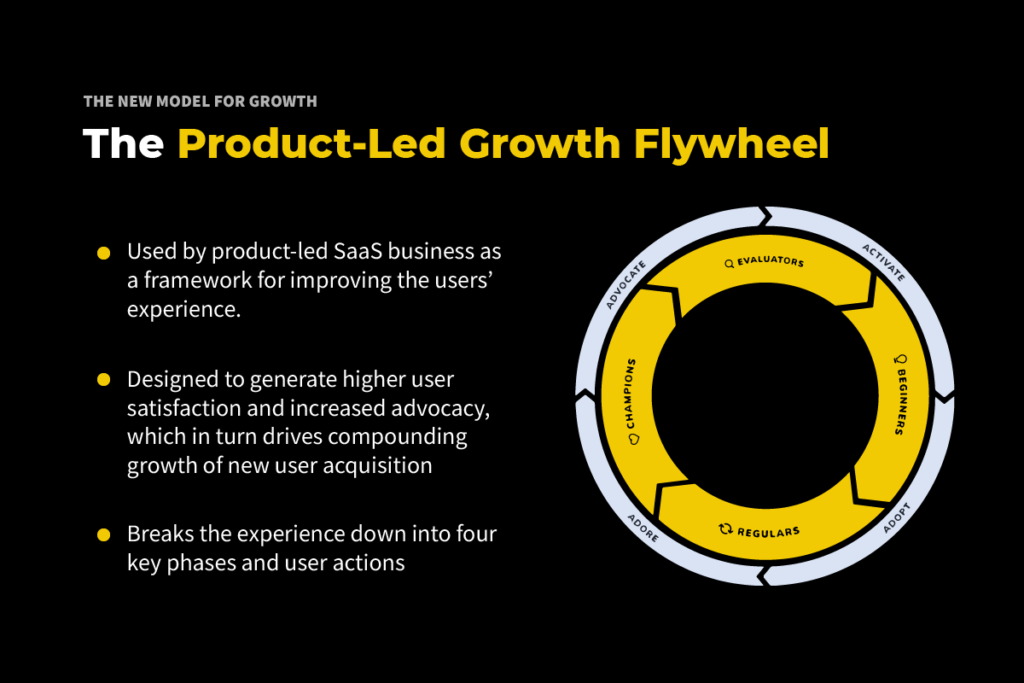
When you craft your customer journey correctly, you're going to increase user satisfaction and retention and customer advocacy as well – a huge source of new user acquisition.
This is the flywheel effect that turns potential customers into paying customers.
It's a reimagining of the classic Pirate Metrics. The structure and each step’s corresponding user type are as follows:
- Activation (Evaluator)
- Adoption (Beginner)
- Adoration (Regular)
- Advocation (Champion)
Let’s dive into each framework step and then explore the product-led growth metrics that will help you incorporate it into your customer journey.
Activation (User Type: Evaluator)
Users at this stage are new to your product or are free users with little or no prior experience of your product. They’re cautiously excited, but yours isn’t the only product they’re checking out.
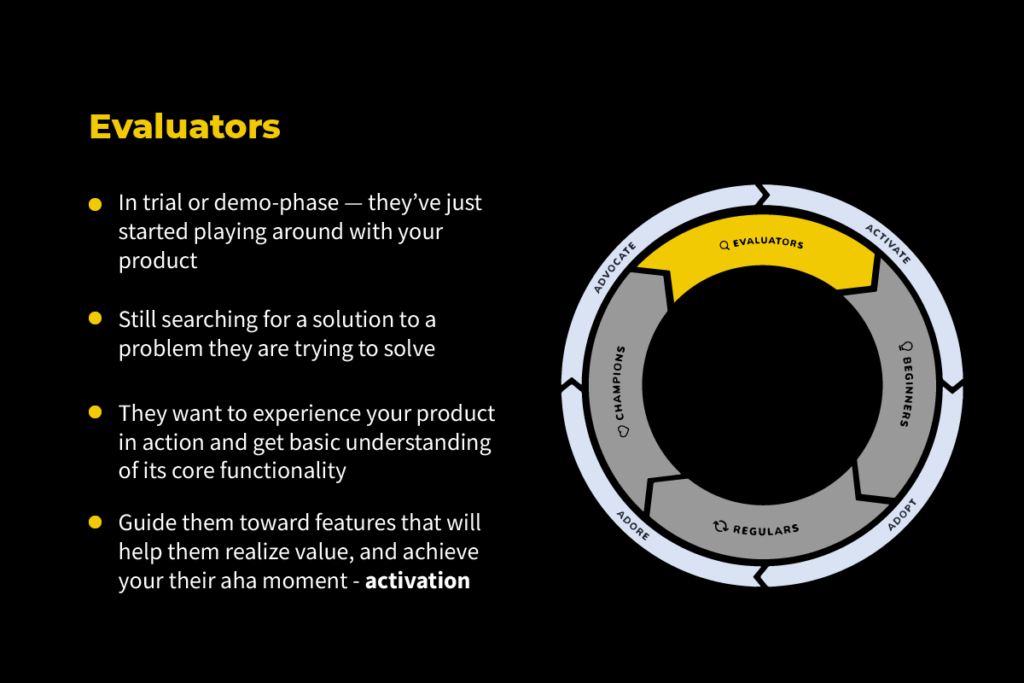
All of your users come to your product to solve a specific problem. You want to focus on driving them to the “Aha! moment” – their activation moment.
Facebook found that when users added seven friends within the first 10 days of using the platform, they were far more likely to become long-term users. Seven in 10 became Facebook’s activation model, which meant they designed their initial product experience to drive that behavior – to make it easy, frictionless, and desirable for users to get those first seven friends.
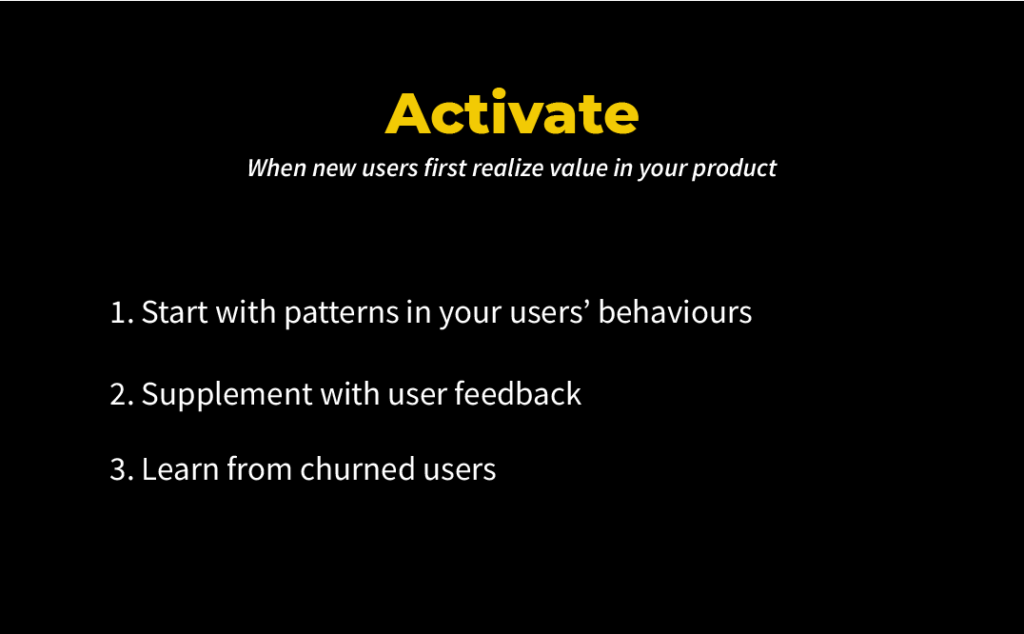
Look for patterns in your users’ behavior. Observe what your best users did when they first started using your product, and if there is a pattern (like the seven in 10), then focus on helping new users follow that pattern.
Supplement this data with user feedback. Behavioral data is hugely useful, but nothing beats going to the source. Ask your users about their journey and activation moment.
That includes feedback from churned users – negative correlations are just as valuable as positive ones. Try to get on the phone or, at the very least, create an exit survey.
If you can find a pattern, design your user experience to drive evaluators to their activation moment.
Adoption (User Type: Beginner)
Once you’ve got those activated users, you want to help them explore and understand the full ecosystem of your product. Show them the best practices, reduce friction, and be there whenever they need guidance.
For this adoption stage, you want to establish guidelines for what normal, healthy usage of your product looks like.
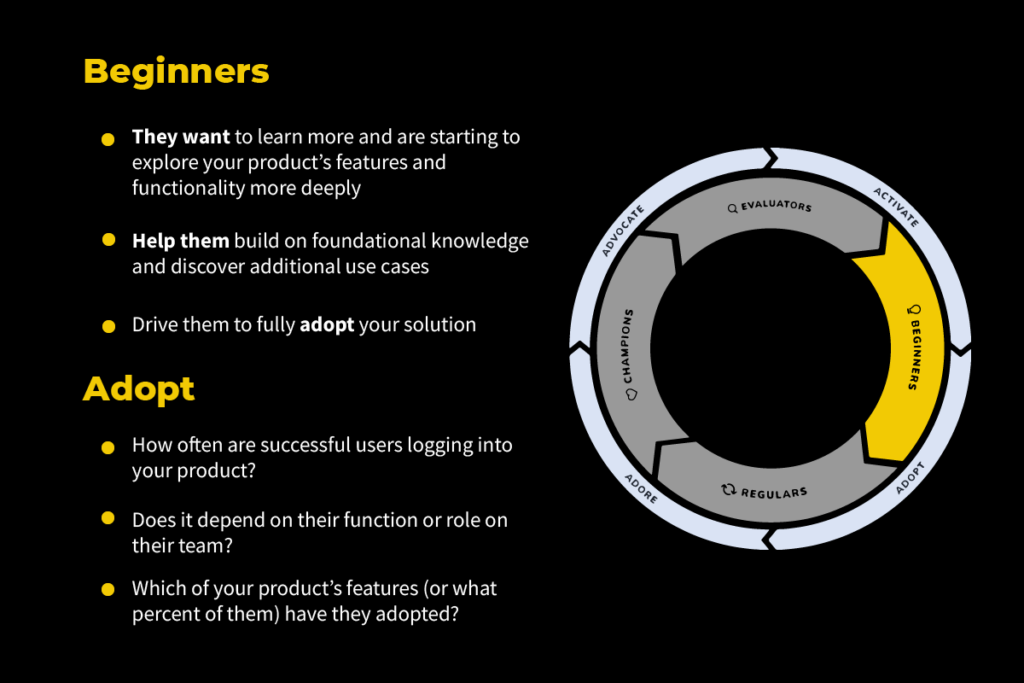
Look for regular users who get value from your product but aren’t power users or advocates (yet!). Then, ask these questions:
- How often are they logging in?
- What features are they using?
- What percentage of your total products do they use?
Establish benchmarks, and then you know the characteristics that define a "good" adopter.
For example, a "good" adopter for a company like Spotify might create a playlist, listen to their Discover Weekly playlist, and record more than two hours of listening daily.
Adoration (User Type: Regular)
For regular users, their product experience of your product should feel like walking into a coffee shop and seeing their order ready on the counter.
At this point, your goal should be to delight and expand their usage even more.
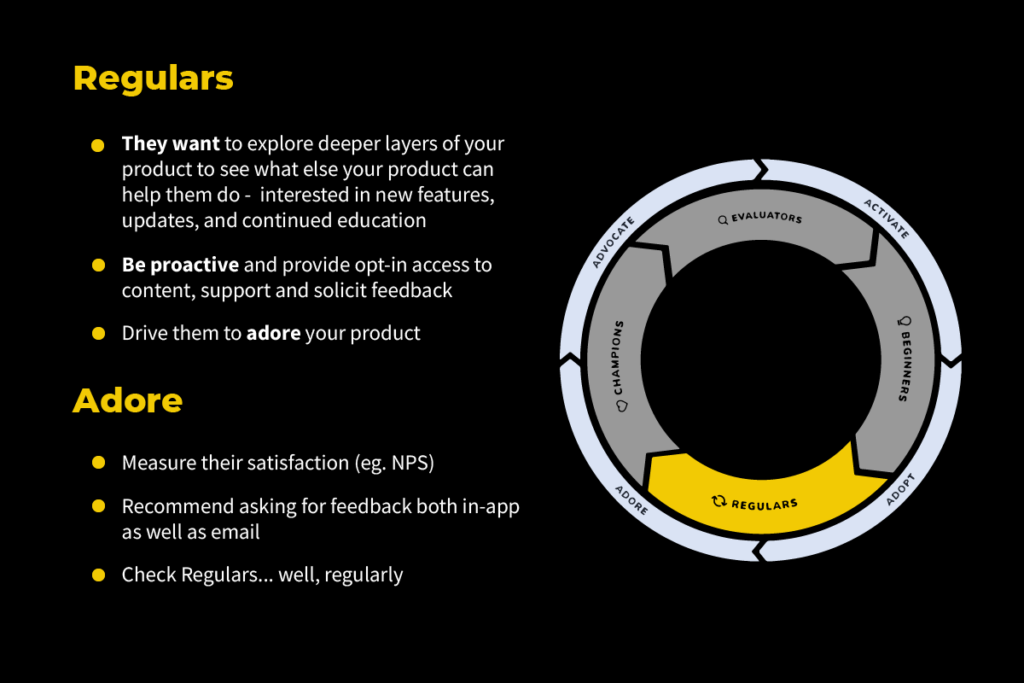
Release new and premium features – not so you can make more money (that can be a great consequence, but it shouldn’t be your primary motivator), but to deliver more value to them. You want to delight your regulars.
Ask for their feedback and measure their satisfaction so you can understand whether their journey is at the level of coffee-on-the-counter or if it’s still brewing.
Advocation (User Type: Champion)
Heavily invested champion users recommend your product and have formed an emotional connection with your product. You may see them talking to you on social media, their content marketing efforts, or their email list.
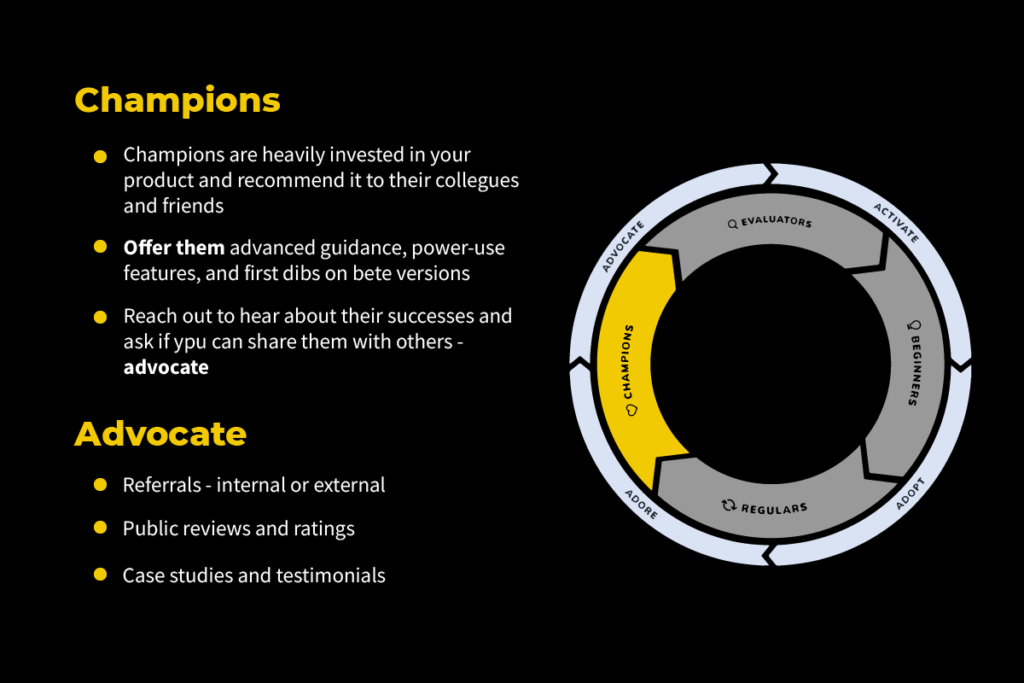
Your goal with champions is to encourage their advocacy through referrals, recommendations, public reviews, case studies, and testimonials.
Tap into their delight and enjoyment of your product and harness it to create a new wave of evaluators at the activation stage.
5 Crucial Product-Led Growth Metrics to Track for Your SaaS Business
Let’s look at some metrics that will help you get excellent returns from using the Product-Led Growth Flywheel.
Time-to-Value (TTV)
TTV is the time it takes new users to reach their activation moment.
Your goal should be to have this metric as low as possible – you want this down to minutes, not hours or days.
The faster you get users to the activation step, the more likely it’ll be that they stick around.
TTV Metric Goal
Your goal is to lower your time-to-value as much as possible. The quicker your customers find value in your product, the greater the chance they’ll stick around over the long haul. Never stop taking steps to lower your TTV.
How to Measure TTV
Measuring TTV starts with defining what your customers perceive as value, and then you can determine how to calculate the metric best. For example, if your customers receive value by accessing a library of resources upon creating an account, you can track how quickly it takes them to reach this stage.
Product-Qualified Leads (PQLs)
PQLs are leads who have already experienced your product’s value.
These are typically activated users with a free trial or freemium account – the kind of leads you know are ready to pass on to your sales teams.
If you’re talking about PQLs, you will already be dealing with free users for the sales conversion, probably sitting in the adoption stage.
PQL Metric Goal
Your primary PQL metric goal is to convert free users to paid users. It may not be your only goal, but it should be the one that drives everything you do within this metric.
How to Measure PQL
There are three metrics within the “PQL umbrella” to track:
- The general number of PQLs over a specific range of time
- PQL rate
- PQL to paid conversion rate
Expansion Revenue
Expansion revenue is the anti-churn and one of the most important levers for SaaS growth.
Expansion revenue measures the revenue generated from existing customers through upsells, add-ons, cross-sells, etc.
Expansion Revenue Metric Goal
Set your expansion revenue metric goal based on factors such as the size of your customer base and the monthly recurring revenue attached to them. Your goal will change as your customer base grows.
How to Measure Expansion Revenue
Calculate expansion revenue by adding additional revenue from current customers for a specific period, such as one month.
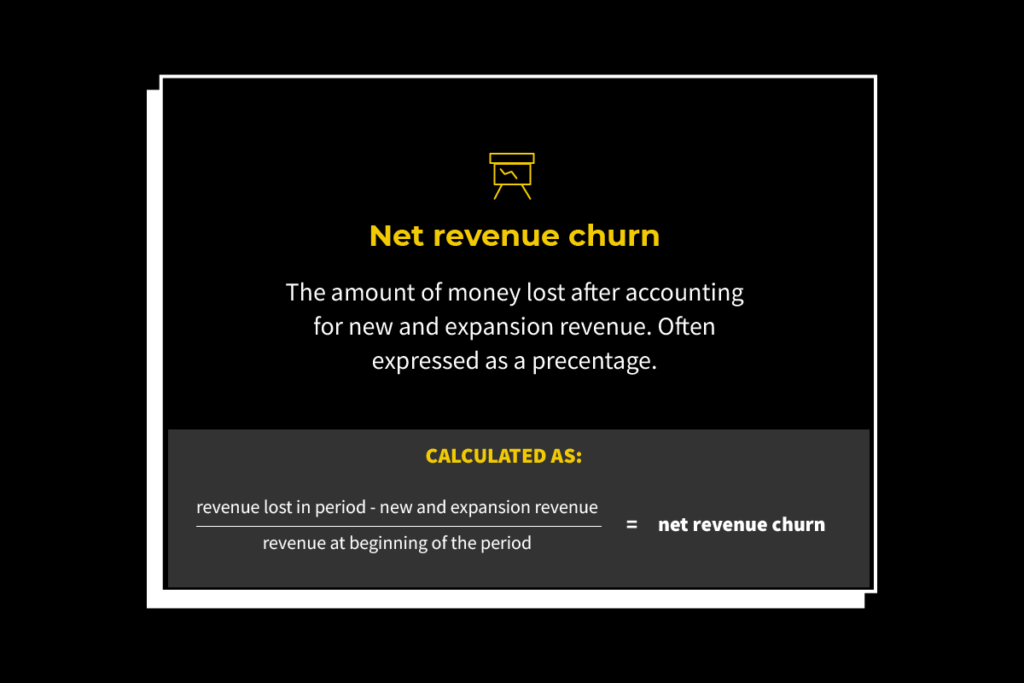
Net Revenue Churn
Net revenue churn measures the amount of money lost after accounting for new and expansion revenue and is often expressed as a percentage.
Net Revenue Churn Metric Goal
Your net revenue churn metric goal is simple: keep this number, expressed as a percentage, as low as possible. The lower your net revenue churn, the more revenue you’re generating.
How to Measure Net Revenue Churn
Here’s the formula you can use for this metric:
(X-Y)/Z= net revenue churn
- X= revenue lost in period.
- Y= new and expansion revenue.
- Z= revenue at the beginning of the period.
For example, a company that lost $100 in revenue but gained $200 from new and expansion revenue will have a net revenue churn of –10%. (100-200/1000 = –0.1) This is called net negative churn.
If you can build a business with net negative churn, you have a great chance of success and attracting future investment.
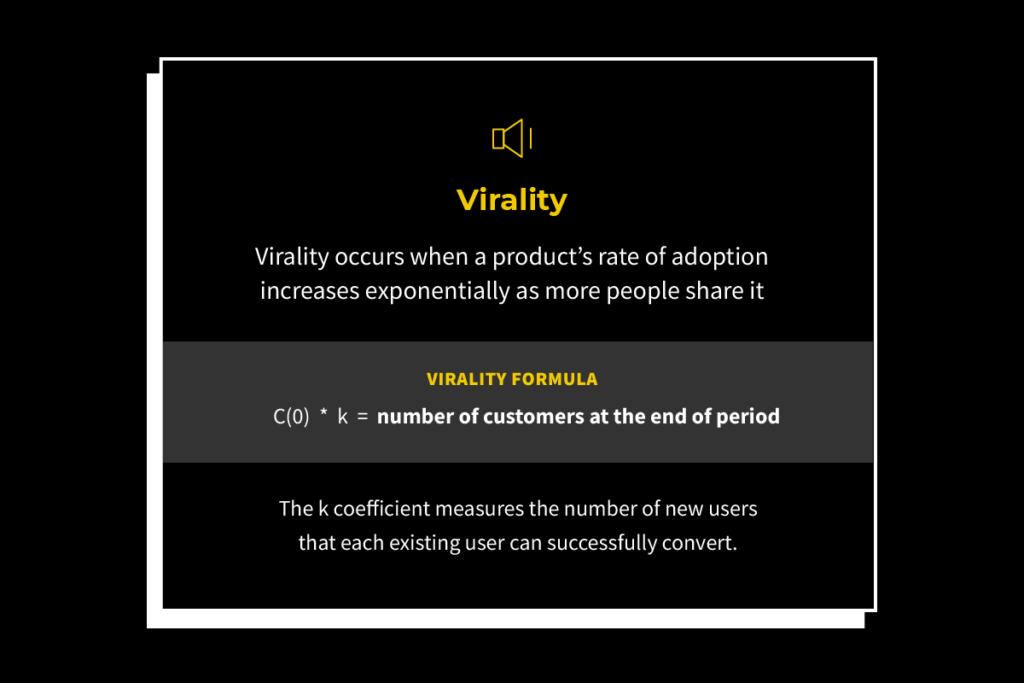
Virality
Virality is the average number of new users an existing user can bring onboard and convert to paying customers.
Your business can grow exponentially with a strong virality metric.
Virality Metric Goal
Attaching a specific virality rate to your product is challenging because it’s a factor out of your control. Set a goal of increased virality as your customer base grows.
How to Measure Virality
Here’s the virality formula:
C(0) * k = number of customers at the end of a period
In this formula, “k” measures the number of new users that each existing user can successfully convert. In the early days of your product, you may not need to measure virality, but as your customer base grows, there’s a greater chance of an increased adoption rate.
FAQs About Product-Led Growth Metrics
Even with the information above, you may still have questions about product-led growth SaaS metrics. Here are three of the most common, all of which may lead to additional questions that can help you better plan for the future.
Why is Measuring PLG Metrics Important?
Metrics are only one part of the picture, but measuring them is important for several reasons. Most importantly, it provides a clear view of your company’s performance. With this, you can make the necessary adjustments at the right times.
You need to understand how your company is performing in every area. Hiding from PLG metrics, good or bad, isn’t in your best interest.
What is the Best Product-Led Growth KPI to Track?
The word “best” is subjective, and what it means to you may not match what it means to another company. Choose the best KPI for your company based on what’s most important to its performance.
Since you’re unlikely to pin down only one KPI, consider creating a short list of three to five.
Who is Responsible for Product-Led Growth Metrics?
Typically, a Growth team member, such as a Growth leader, sets and tracks product-led growth metrics. Assign a designated person or people for this responsibility, as it’s a responsibility that shouldn’t be passed around.
Metrics Are Only Part of The Picture
According to HubSpot’s State of Inbound report, new users consider word-of-mouth and customer references to be primary sources for purchasing new business software.
If you’re not providing an exceptional user experience, all the product-led growth metrics in the world won’t save you. You can spend hour after hour on flywheel product-led growth metrics, but it's not likely to have a significant impact.
Optimize to your heart’s content, but always be sure to deliver joy, value, and results to your users. This is what customer satisfaction and customer retention are all about. Continue building a solid foundation for your SaaS company by signing up for our free Fundamentals of Product-Led Growth training.