
If COVID-19 taught us anything, it’s that being dynamic is essential to survival. Being stagnant is useless, and this is why we have SaaS survival metrics.
This article lays out how to apply survival metrics to your product’s mission, vision, and strategy, along with how to make it work for your product-led business. I’ll touch on:
- What SaaS Survival Metrics Are
- Finding Your Survival Metrics
- The Three Levels of Survival Metrics
- Three Phrases to Communicate Effectively
- Examples of Survival Metrics in Action
Throughout this article, we’ll use Bobco as an example to set the stage for how survival metrics work in action.
A brief history of Bobco
Bobco, like most businesses, spent the last quarter of 2019 building a strategy that aligned with their mission and vision. But by March 2020, their strategy was no longer relevant. As a result, they spent the rest of the year trying to figure out what to do. In fact, at the end of that year, they had to let go of their entire product team.
Bobco then brought in a new product lead. She said, "We have to change things here because we're going into 2021 and we need the ability to pivot promptly."
When it comes to product-led growth, it’s crucial to pivot to what the customer needs.
Bobco had never experienced pivots before.
What were they scared of?
They were scared of pivots being slow, they were scared of political sniping, and they were afraid the pivots would be emotional rather than pragmatic.
So how do you pivot in a way that feels safe and pragmatic versus emotional and reckless?
There are three rules to pivot both fast and safely.
Pivots should be:
- Fast: The sooner you can change direction when things aren’t working, the better.
- Politically Safe: The sooner you can remove the possibility of sniping, the better. This is extremely important.
- Data-Informed: The sooner you can have data to back your decisions, the better. Don’t go off intuition; tie your changes to something.
This is where SaaS survival metrics come in. Using the data from survival metrics, you can pivot fast and safely in an ever-changing market to adapt in real-time to the needs of your users.
To ensure the pivots at Bobco would fit those three rules, their product lead met with the team and told them they were going in a new direction.
Then she introduced survival metrics.
What SaaS Survival Metrics Are
Survival metrics are quantifiable, quantitative metrics that help a product team determine if an initiative or project:
- Is worth investing in.
- Requires a pivot.
- Needs to stop completely.
You can think of them as a forcing function. These metrics help product teams manage the sunk cost fallacy by putting forth resource allocation and company incentives, both implied and direct to teams from the beginning.
Give these teams the ability to change and lead with these changes on repeatable intervals, and ensure they have the permission to act quickly if thresholds are crossed. All metrics presented to the teams must have the okay from leadership to give them the power to pivot when needed.
Don’t overthink the pivot.
It should be as simple as knowing what affects the company, what’s important to them, and then moving to align with that knowledge. In product-led growth, it’s vital to adjust with a product as it grows, and that’s what survival metrics help you do.
Finding Your Survival Metrics
How exactly do you find these metrics?
There are three main questions that company leaders need to answer to set the stakes for the survival metrics of a business.
#1. What markers do we need to see to commit more resources to this initiative?
(E.g. “If we get X metric, it’s worth adding more resources.”)
These can be:
- People
- Business Events
- Changes in Cost
- Profit and Loss
… or all of the above.
In the case of Bobco, their product lead talked to engineering, design, marketing, the CEO, and the CFO. The question she asked was, "What markers do we need to commit more resources to this initiative?"
This is an important question to ask because if you've ever been in a project where someone says, "If I would've known that, I would've given you more resources to succeed."
Often when people think they're out of resources, they're usually not – especially if it's vital to the company. Knowing those markers early on can help make your case for more resources so you can continue.
#2. What are some non-negotiables for the team/company?
(E.g. We have to get this feature out, or else we’ll be sacked.)
Communicating the non-negotiables is essential to understand:
- What has to get out the door.
- What can't get out the door.
- What changes are in the marketplace.
- And how you’re perceived.
It’s also a trust-builder for CEOs and the C-suite because they're usually detached from the day-to-day tasks and want results.
#3. How much are we willing to let this initiative cost us?
(E.g. We can afford to put this out if we can build it with three engineers, one designer, and one PM in six months.)
The cost can be resources or people.
For example, you may need to ask, “Is this going to be worth three engineers or six engineers?”
When is it not worth doing?
Defining these numbers is extremely important because they permit you to move in a fast, politically safe, and data-informed way.
The Three Levels of Survival Metrics
Once the data starts flowing in, you need to organize it.
You can best organize the data by formatting it into three different levels to make it highly readable. Present the data in a way that makes it easy to reference and understand by your teams doing the day-to-day work.
Here are the three levels.
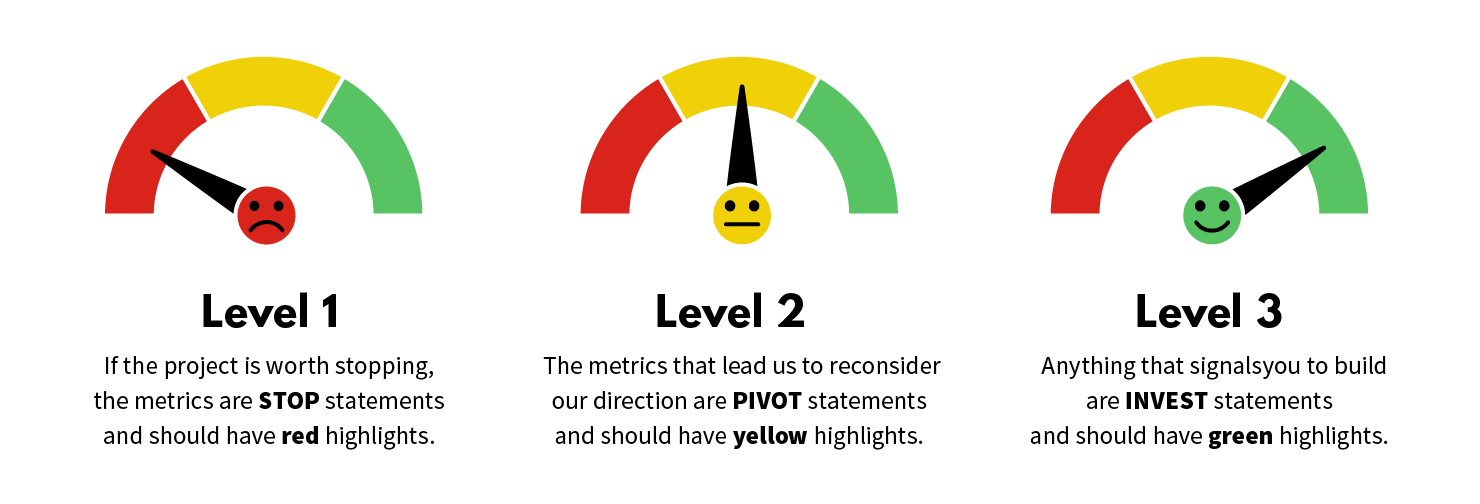
Level 1: If it’s worth stopping the project, the metrics are STOP statements and should have red highlights.
Everyone working on the project should clearly understand what the kill switches are. For many companies, there are several kill switches, but nobody talks about them. This tends to get teams fired, or consultancies sacked on high net worth projects.
Stop metrics need to be communicated upfront and highlighted in red because red is typically universal for STOP. Red is easy to see.
Level 2: The metrics that lead us to reconsider our direction are PIVOT statements and should have yellow highlights.
They aren’t quite stop statements, but they require you to slow down and carefully consider your options.
These metrics make up the meat of your survival metrics and are going to force your team to take a step back and say, “We need to reconsider. Maybe we need to change our direction slightly or in a big way.”
These are the metrics that help you know when it’s time to change over.
Level 3: Anything that signals you to build, even if things are a little rocky, is an INVEST statement and should have green highlights.
These are less likely, but they’re critical to communicate. For instance, when you encounter a problem or run into something exciting, it’s easier to communicate the resources you need for success when you understand the signals and initiatives you are looking for.
The product lead at Bobco gathered this information and facilitated conversations and workshops with stakeholders. Finally, the necessary information was put on the table for everyone to see.
These conversations can be fun as they provide insight into the incentives of other teams in your company. Often, teams have interesting data but no reason to share it.
Sharing data from various teams helps build trust and keeps pertinent data upfront. This helps align your product development to what's happening on the ground.
Signals Vs. Noise
Anything critical needs to be reflected in the survival metrics. It’s essential to understand the difference between a signal and noise.
If anything is important enough to change the project’s status – like a team breaking the company’s values, going over budget, or the need for more investment – it should be reflected in the survival metrics.
Signals that make up the data in survival metrics are qualitative (i.e., interviews and observations from conversations) and quantitative (i.e., surveys and usage data). It’s critical to have both for a complete understanding of what’s going on.
Three Phases to Communicate Effectively
Part of the product manager’s job is to take tons of data and make it digestible for each team. This way, they can make intelligent and timely decisions.
How do you break down the metrics and efficiently communicate them?
Here are three phases to help you do that.
Translate: What do these metrics look like? Put them into a readable format for everyone.
Prioritize: Get rid of the information that’s not important and find the signal. Anything having to do with vision, your mission statement, or your strategy is at the top. If something appears important, but there’s uncertainty surrounding it, write it down and check in on it personally instead of giving it to a team to focus on.
Cadence: Tie the subject matters into a retro schedule to make it easier for teammates to engage. You don’t have to add a new process but bring it into a comfortable space where the team can regularly engage.
Examples of Survival Metrics in Action
In the case of Bobco, the product lead broke it down like this:
Their STOP statement: “Bobco doesn’t use third-party info. If we have to grab information from third party sources to complete our chat feature, scrap the project and invest the resources elsewhere.”
Bobco is big on not using third-party info, and it's essential to the founders they don’t do that. They’re big on conferences, so having any product that does that is a huge black eye to the company. So it's a stop statement.
A PIVOT statement: “If the AWS bill is projected to jump more than 10% due to a production release, we will need to discuss ways to lower the projected bill immediately.”
At Bobco, engineering had an issue with their AWS budget, and they needed to keep it low. So the director of engineering said, “Is the AWS bill projected to jump over 10%? We have got to kill this. It's not going to fit in our budget.”
Operations said the same. In that case, the product lead lined up this pivot statement: "If the AWS bill is projected to jump more than 10% due to production release, we will need to discuss ways to lower that projected bill immediately."
It's time to pivot, time to change.
An INVEST statement: “If our beta invite-population is 2x our current projection, this could signal real excitement from our customers. It’s worth taking a second and talking about ways we could expand this project”.
The product lead asked the CEO what number it would take for them to continue to push through with a new chat feature.
What Happened to Bobco?
Bobco started to invest and saw the power of these metrics. As a result, the teams were able to feel pretty confident in their next step.
Survival metrics taught the teams to trust the data in their decisions to move forward. And ultimately, that's where you want your teams to be.
The goal is for your teams to collectively:
- Understand the vision.
- Accept the vision the teams are laying out.
- Then, execute the strategy that comes from that vision.
In a constantly changing world, it is essential to instill confidence in your teams and give them the freedom and knowledge to respond to data and make the necessary pivots.
Bobco was able to take those metrics, apply them to their project, and find big success. They grew their morale; they knew what they were doing, and they were focused.
As product people, our job is to help the organization that we're in make more intelligent decisions. That's what survival metrics do; it helps our teams feel comfortable with changing direction.