
Tracking key performance indicators (KPI) is vital to the growth and success of product-led companies. Your KPIs should align with the organization, the project, and be both achievable and actionable. Knowing what key metrics to track, though, is where a lot of product-led companies slip up.
Ifyou want to thrive and grow in a super competitive market, there aresome key metrics every team working within a product-led organizationneeds to understand…
To watch the video on this topic, hit play below…
3 steps for leveraging important data
If you’re a product-led company, it’s reasonable to assume that product is the primary way you acquire, expand, and retain customers. However, you need to make sure that you take every win, every loss, and every click as an important lesson. This means you need to LISTEN to the data.
Datasupplies you and your team with the opportunity to learn more aboutyour product and your customers.
So,how can you learn how to leverage data to make better decisions?
Hereare three things you need to think about when it comes to leveragingdata:
1. Visualize
Datais more than random numbers on a screen. You need to visualize yourdata properly. You can do this by displaying it in a bar chart, or agraph of your choice. Doing this will allow you to see the dataclearly. Tracking data becomes a lot less tedious and tiresomebecause you can visualize the data immediately.
2. Segment
Youmay wish to segment your data to help track certain key factors.Segmenting data helps you to see different customer behaviors andallows you to see how each demographic or customer category isperforming.
3. Compare
Finally,you should compare your existing data with historical performance(perhaps last month, the previous quarter or year, etc.). You canalso compare data to your competitors or against the industrystandard to see how your product-led company compares to others inyour industry.
General & Admin KPI’s
One of the most important metrics all product-led businesses need to track is finance and HR. You’ve probably been tracking many of these components in your business already because finance metrics tend to be very similar across different businesses and industries.
Whenit comes to measuring finances, the key metrics to track includerevenue, cash, and burn/earnings. For HR, you should trackengagement, retention, and efficiency metrics.
Below,you’ll see an example of how product-led companies can trackfinance metrics within their company…
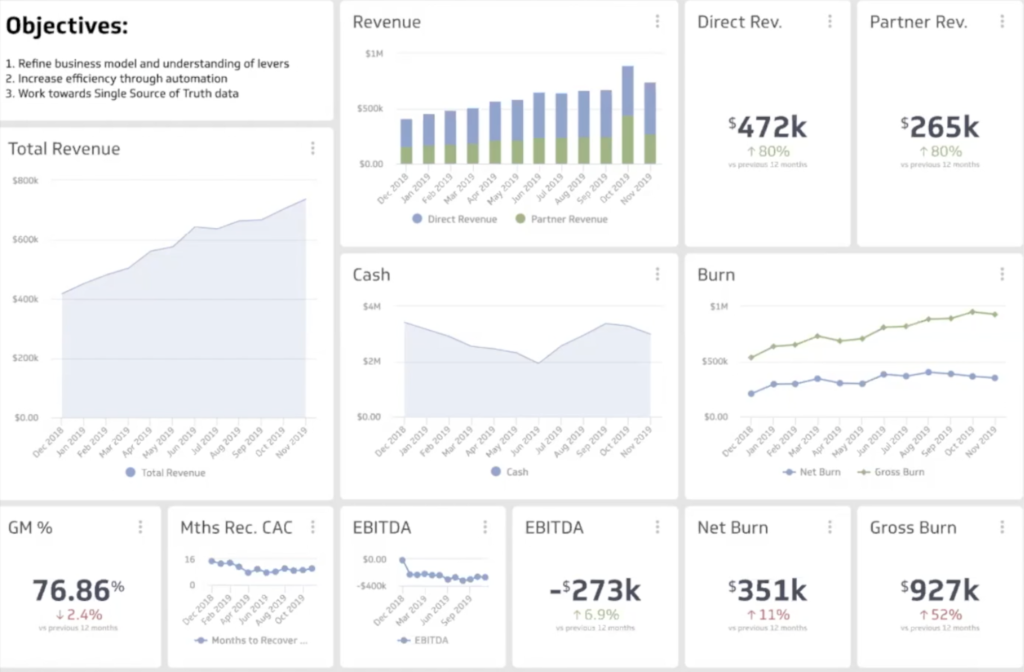
As you can see, this company has visualized its metrics, segmented its findings and compared the results to the previous year on a finance dashboard. This might be something that your company can introduce to make it easier to track key financial metrics.
Youcan create a HR metric dashboard to help with things like recruitmentand hiring, diversity, culture, engagement, and so on. Many companiesoverlook HR metrics, but this is actually one of the most importantthings to measure in any company.
Here’sa look inside an HR metric dashboard:
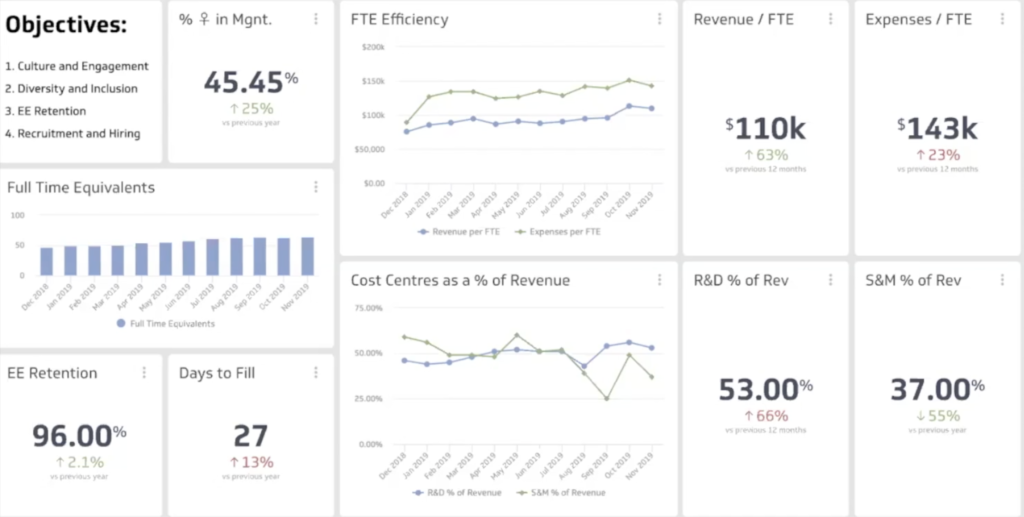
From this, you can see that it’s largely finance-based. But you’ll also notice that metrics for revenue for full-time equivalent and expenses. It’s fairly easy to compare these metrics to other companies in your industry. Eventually, you will hope to see that the metrics for revenue per employee will increase while expense per employee decreases.
Success
Howcan you measure a product-led company’s success?
Well,it starts by tracking key acquisition metrics such as wins, averagenew MRR, and efficiency.
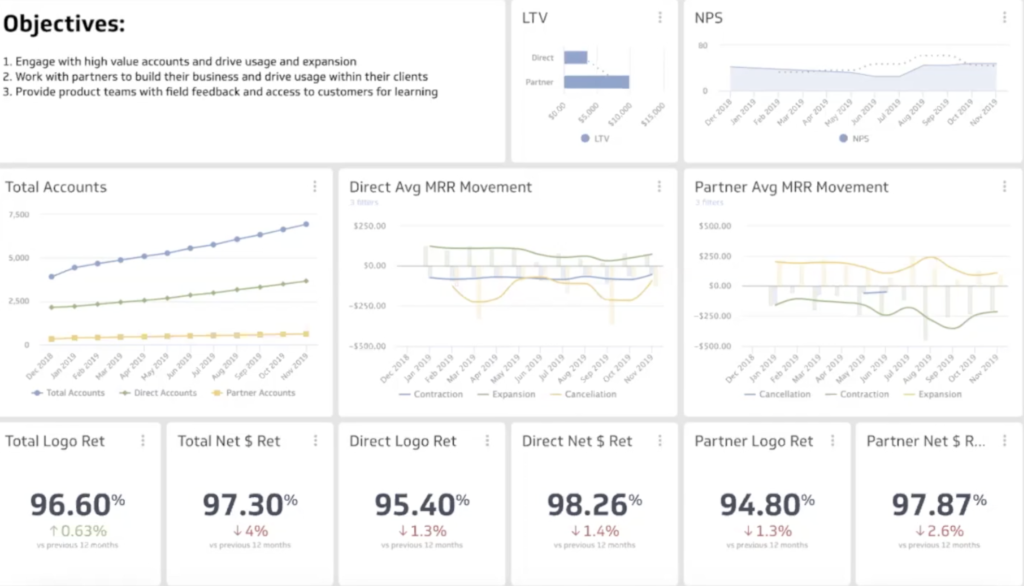
Below, you’ll see a fairly typical acquisition tracking dashboard. In the top left corner, there is a shortlist of objectives, which helps your team to focus on what you’re measuring and why. Having clear objectives like this helps everyone on the team remember the purpose of tracking specific product data and to use the objectives to refer back to throughout the week or month.
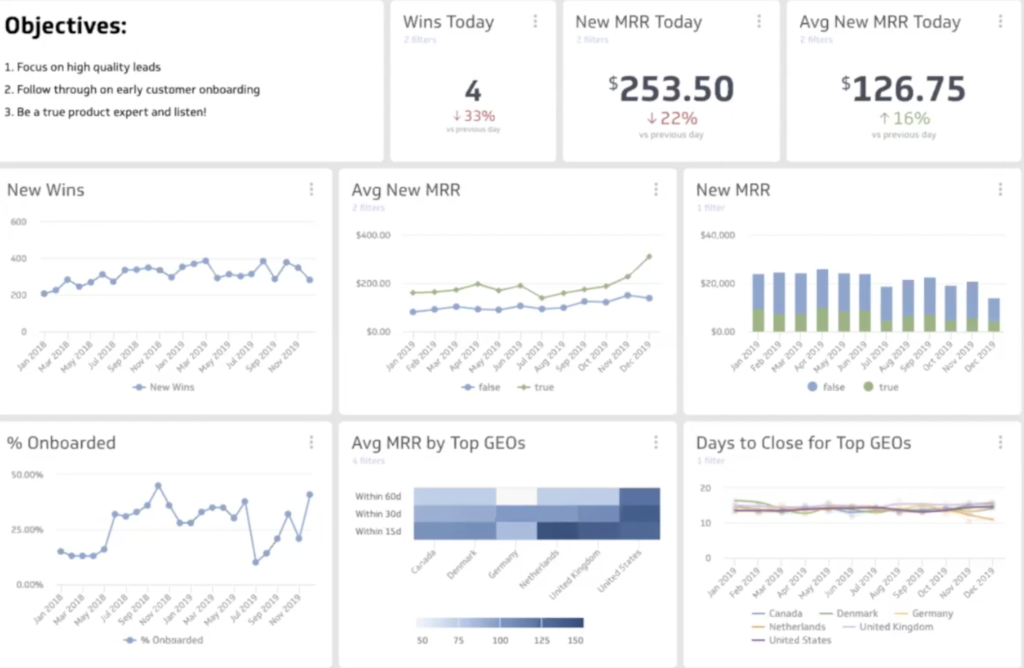
Tracking things like wins, new MRR and average new MRR in a competitive setting like the one you see displayed above supplies invaluable data to the team. They can see what’s going well, what areas they can improve on next month, and how they compare to other companies.
Youcan also measure onboarding, which means you track how many newcustomers you’ve had within the last 30 days, for example.
Measuringretention is vital for any product-led company. We track a variety ofmetrics within the retention umbrella including total accounts,partner average MRR movement, and so on. The two most important areasof retention to track are the total logo retention rate and thedirect net $ retention rate.
So,you definitely want to think about adding those metrics to yourretention KPI dashboard so the retention team can look at the datawhen required and work to impact the results!
Product
When it comes to identifying key product metrics to track, you need to think about things like trial engagement, conversion, 90-day retention, active users, engagement (NPS) and quality/ SRE.
Takea look at the main product metric dashboard below:
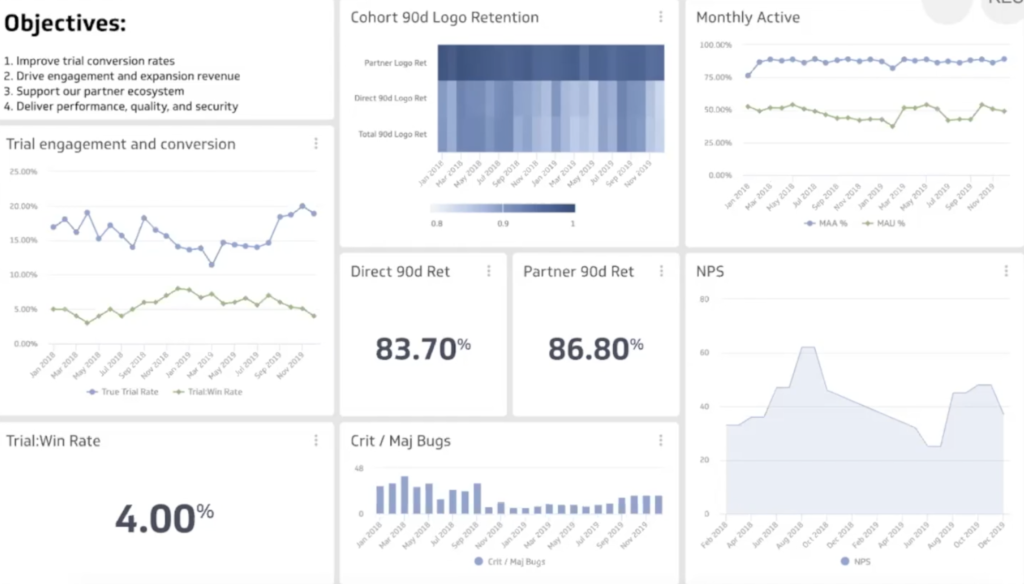
From this dashboard, you can see that we track a range of metrics that fall within the overall product category.
Oneof our main objectives is to improve trial conversion rates, which iswhy we track this closely. Tracking this metric as early as possiblewill give you insights as to whether a change you made to a producthas been successful or not.
The90-day indicator metric allows us to see just how successful andeffective a product has been. If customers are hanging around for 90days and continuing to use and engage with the product for aprolonged period of time, it’s a clear signal that people areinterested in your product.
Ifany metric is lower than you’d like, encourage your team to work toimprove those metrics. Every team needs to identify meaningfulmetrics that are important to them and their company. The morespecific you can get, the better.
Marketing
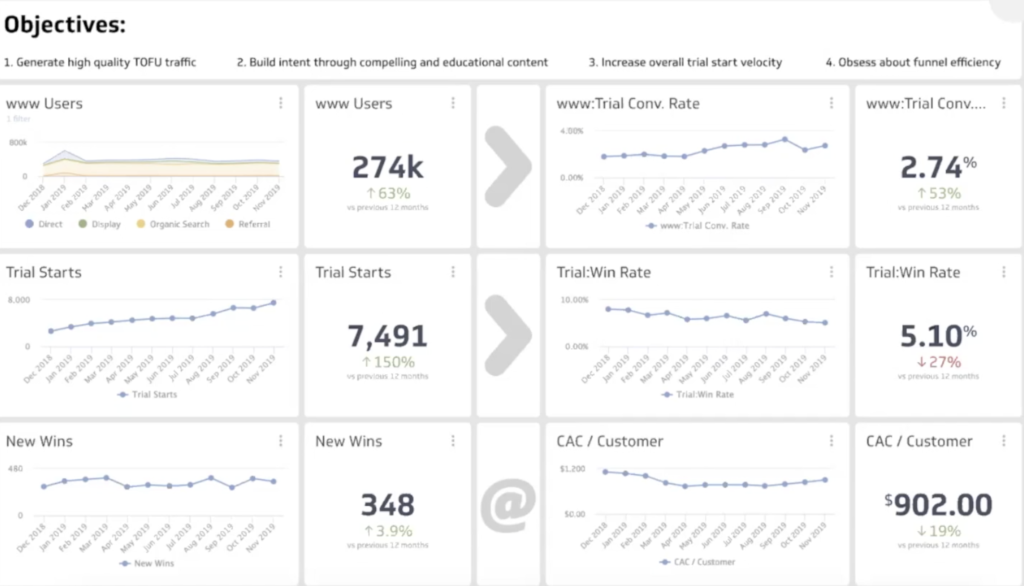
Like with other departments within your organization, there is a wide range of metrics to track within marketing. Some key areas to look at include content marketing and tracking things like web traffic, paid advertising, MQLs/PQLs, conversion rate, and CAC.
Gettingyour marketing right is important for obvious reasons. But, how canyou tell whether your latest marketing campaign is a great success…ora giant flop?
Youtrack it (of course!).
Itdoesn’t have to be overly complicated. I suggest tracking keymarketing KPIs such as trial starts, new wins, win rate, trialconversion rate, and so on. If you want to know what other marketingmetrics you should measure within your product-led company, take alook at the marketing metric dashboard below:
Measuring KPI’s and important metrics is a great way to help grow your business in the right direction. However, we understand that every company is different, and you might want to track different metrics than other product-led companies and your competitors.
If you need help identifying what metrics to track, you can use the MetricHQ tool from Klipfolio, which assists you in your search for the right metrics to track through visualizing, segmenting and comparison.