
Key performance indicators (KPIs) and segmentation are critical for running product-led growth at scale. Yet no one talks about how hard it is to define those metrics or wire up the data to be measured.
In this post, you’ll learn how to develop contextual KPIs for your product-led business from SaaS user research.
Here’s what we’ll cover:
- KPIs Need Contextual User Research
- Data that Grows Your Business
- Collecting Customer Data Is Not Always Easy
- Your Data is a Product
- How to Build a Customer Snapshot
Let’s get started.
KPIs Need Contextual User Research
A few years ago, I started at a B2B SaaS app that used a bottom-up, go-to-market motion. My job was to convert self-service users into paying customers.
A KPI dashboard showed that the company conversion rates were low. Our sign-ups were not turning into paying customers. Why?
I figured better segmentation was needed or a more granular way to slice and dice the data.
At the time, I didn’t have the skills or access to the data to do this. So, I started with the one thing I already knew how to do. I downloaded a list of the company sign-ups for the day and placed that CSV into a spreadsheet. Then, I analyzed the information row-by-row, line by line.
What I discovered was something the CEO would not want to hear: the company had a very successful advertising campaign, but it brought in a ton of junk leads.
Cookie-cutter KPIs don’t cut it for product-led growth.
Data that Grows Your Business
If you want to understand the right way to grow your product, you need to know the answers to these two questions:
- WHO is signing up for your product?
- WHAT are they doing in your product that leads to monetization? This includes self-service conversion, along with happy users that influence an enterprise opportunity.
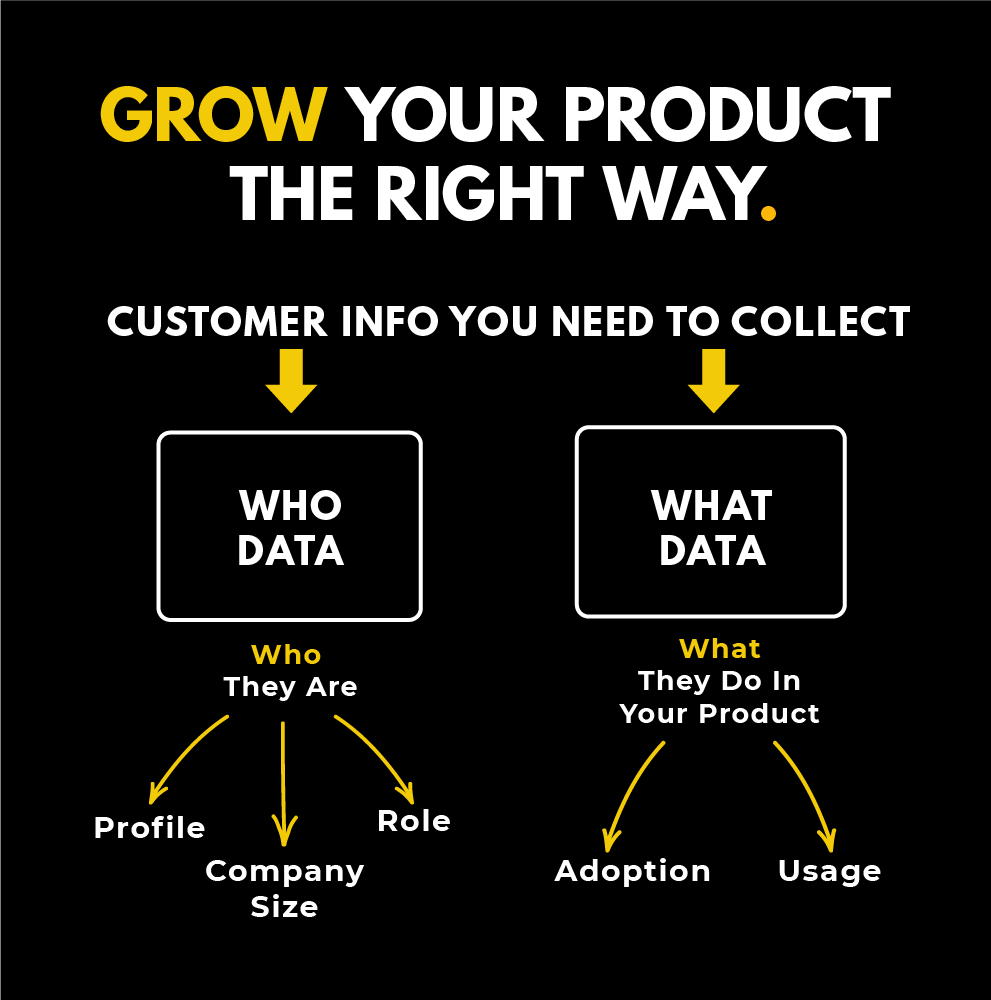
Collecting WHO Data
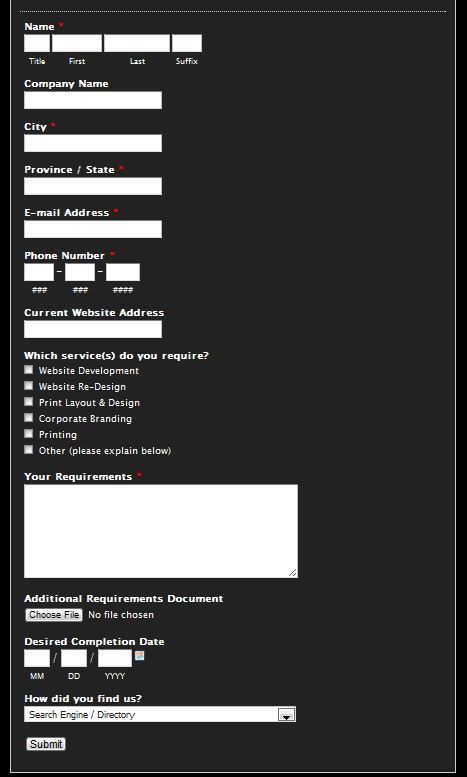
The easiest way to get information from customers is to ask them to provide it. But remember, every additional form field adds more friction.
For example, would you fill out this sign-up form?
Additionally, you can enrich data. Third-party services can track your new users for a fee. This additional data, matched with information you already know about existing users, helps create a better understanding of who your customers are. Doing so helps reduce friction, but unfortunately, these data services can be expensive and unreliable.
Collecting WHAT Data
Collecting WHAT data has hurdles too.
Companies build products and track all user events. Then, it feeds into analytics and pours into segments.
But monitoring and capturing every activity a person takes in your app is labor-intensive and expensive; you have to store that data and have it somewhere to query against it.
The more data you have, the longer those queries take to run.
Understanding what activities are related to a conversion or monetization event in the future requires a lot of analysis.
The Impact of Missing Data in KPIs
Below are scenarios to explain what can result when customer data for KPIs is missing.
1. Missing WHAT Data
You probably run a sales-led business if there is information about your customers (i.e., who they are), but you don’t have an understanding of how they use your product.
This scenario occurs when a user has signed up for an app and then receives a cold outreach email from an account executive without reference to any action they’ve taken in the product.
The company only knows who you are, not where you are in the customer journey.
2. Missing WHO Data
Now imagine you have a lot of data about what people are doing but no idea who they are.
This scenario might result in false indicator KPIs showing very active users, but none of them are fit to convert.
Let's say you have a freemium SaaS product with a low friction entry point. Customers are able to use the app until a usage marker. Here they encounter a paywall and have to convert to pay.

Thousands of people might sign up for a product, but they don’t convert to paying customers when they arrive at the paywall. Instead, they create another user and continue using your product again for free.
In this scenario, active users are very high, but none convert to paying customers.
If your product qualified leads are way up, but no one is converting, who data is missing to understand whether or not they capture your target persona.
Collecting Customer Data Is not Always Easy
You want to understand who is signing up for your product.
To accomplish this, you might decide to add a new field in the sign-up form to ask new users to enter their job title.
The update is only one more field. How much work could it be?
The answer depends on the setup of your app.
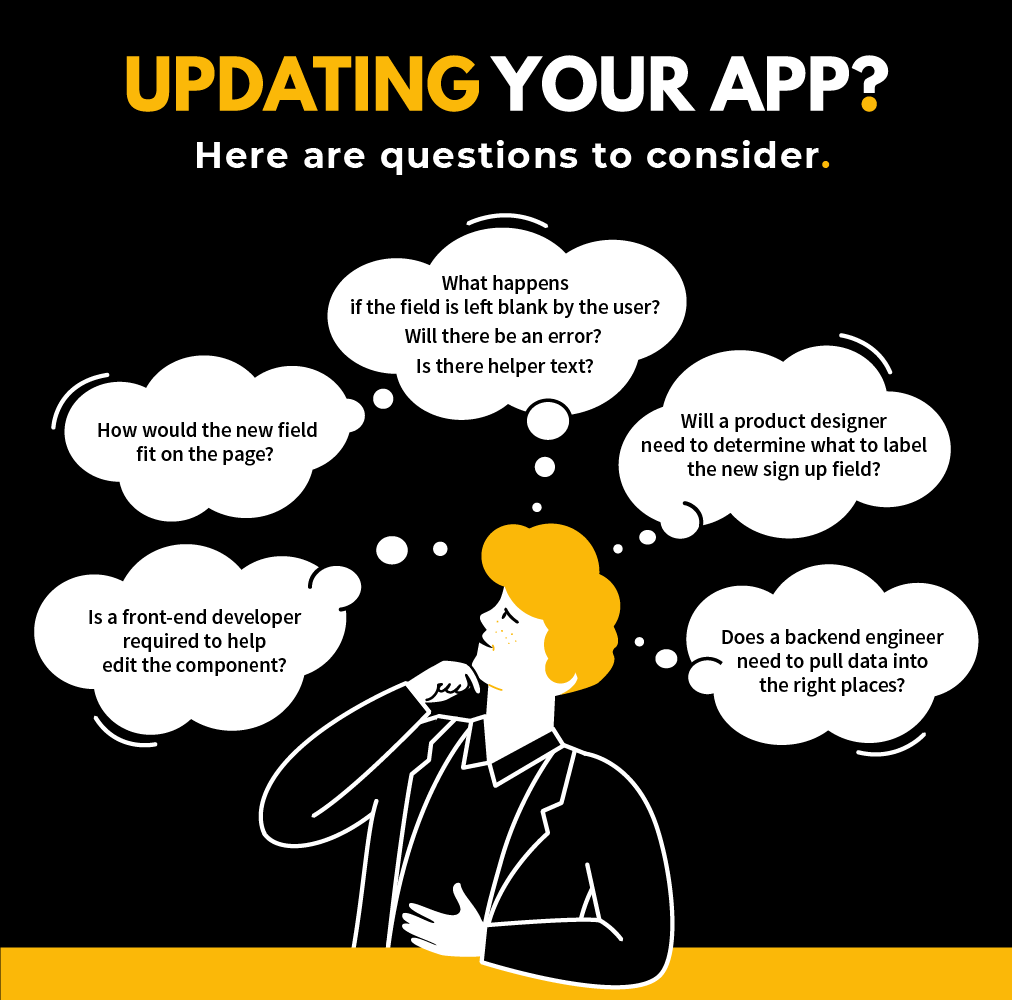
Here are some questions to consider:
- Will a product designer need to determine what to label the new sign-up field?
- What happens if the field is left blank by the user? Will there be an error? Is there helper text?
- How would the new field fit on the page?
- Is a front-end developer required to help edit the component?
- Does a backend engineer need to pull data into the right places?
If so, this means you will probably have to look at some APIs to figure out how to send that data into your marketing automation or customer relationship management (CRM) tool to capture it into your data pipeline to report on it later.
What seems like just one more field in the sign-up form could be a six-week effort including various team players and stakeholders with different ideas.
You have to weigh this work against the other things in your product roadmap.
Just Like Products, Target Customers Change Too
Target customers grow and evolve as companies experience growth –just like products.
New product features are always rolled out. Those signals are inputs into your product-qualified lead criteria that evolve as well.
A backlog of data requests is then commonly built: You need data for this. You need to add a new form field for this. You need to start tracking this.
What happens if you get overwhelmed with all of the data requests?
Start by prioritizing what you need to do first. Consider business-critical metrics versus what will be irrelevant in a couple of weeks.
Your Data is a Product
Your data and metrics are a product with a life cycle. The customers are your product-led leader, product marketer, product manager, or business stakeholder.
What do you do with a product idea when you want to know if it is worth building?
Create a prototype.
Make a cheap, flimsy version of whatever you want to build. Then, place it in front of customers to make sure they understand it. See how they react and what they do.
In UX, making a paper prototype is common.
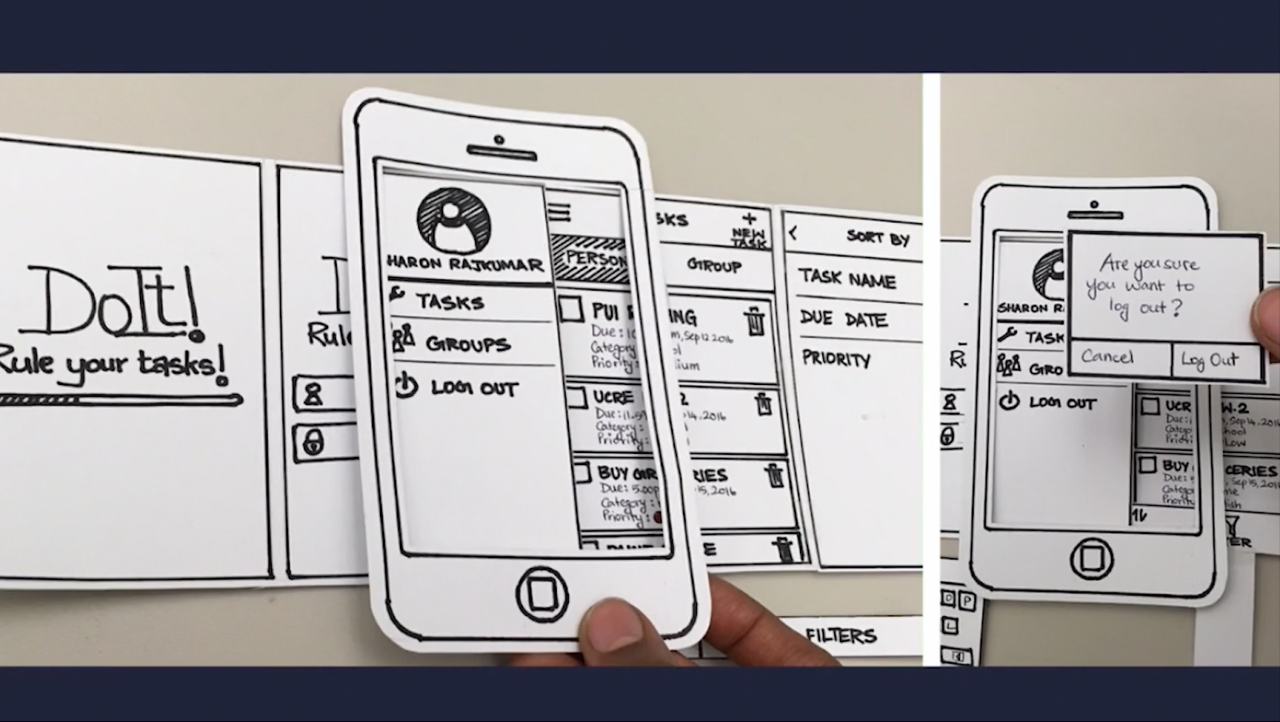
Paper prototypes are cheaper than creating a Figma mockup or wiring a fully coded click-through experience.
Prototypes for Metrics and KPIs
What does it look like to prototype metrics and KPIs?
At this point, I like to fall back on user research.
Typically, SaaS user research means getting a customer on the phone to ask them questions or running a survey. After compiling notes and digging into their opinions, I share the findings with my team.
But there is a different type of customer research.
It’s called a customer snapshot.
How to Build a Customer Snapshot
To build a customer snapshot, you need access to a CRM or user database, along with a couple of hours in elbow grease.
The 4 Steps of a Customer Snapshot
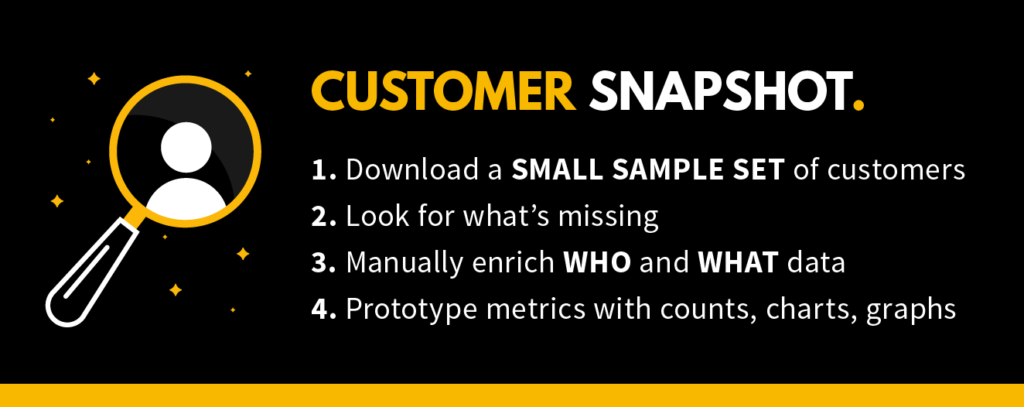
Here’s how you can grab a customer snapshot:
1. Download a small sample set of customers.
First, pull up a list of sign-ups. The list should be small and taken from the system with the most data about your customers. That might be your CRM, marketing platform, or even your product if you have access to pull a list of users for the day.
2. Look for missing data.
Next, make the list of users for the day and see what fields you have for those users.
Ask yourself:
- What data is missing? Can you get those answers, even if you need to do it manually?
- Can you see their plan type?
- Did the user make it to the “Aha! moment” in the product?
3. Manually enrich WHO and WHAT data.
Then, enrich the data manually.
Do this to get a shape of what might make up the new metric or KPI you want to measure.
By pulling enough data, you can layer on your criteria to this small sample set and determine:
- The percentage of people that are qualified.
- The percentage of people who had an “Aha! moment” in the product.
This process is labor-intensive, and it's not going to scale. You cannot do this every day. Set a time limit. Don't spend more than a couple of hours on this work.
4. Prototype metrics with counts, charts, and graphs
Create charts and graphs from your enriched data.
From them, pull numbers and see what it would mean if you had data for your entire customer set.
What decisions would you make? What would you do differently?
Customer Snapshot Example
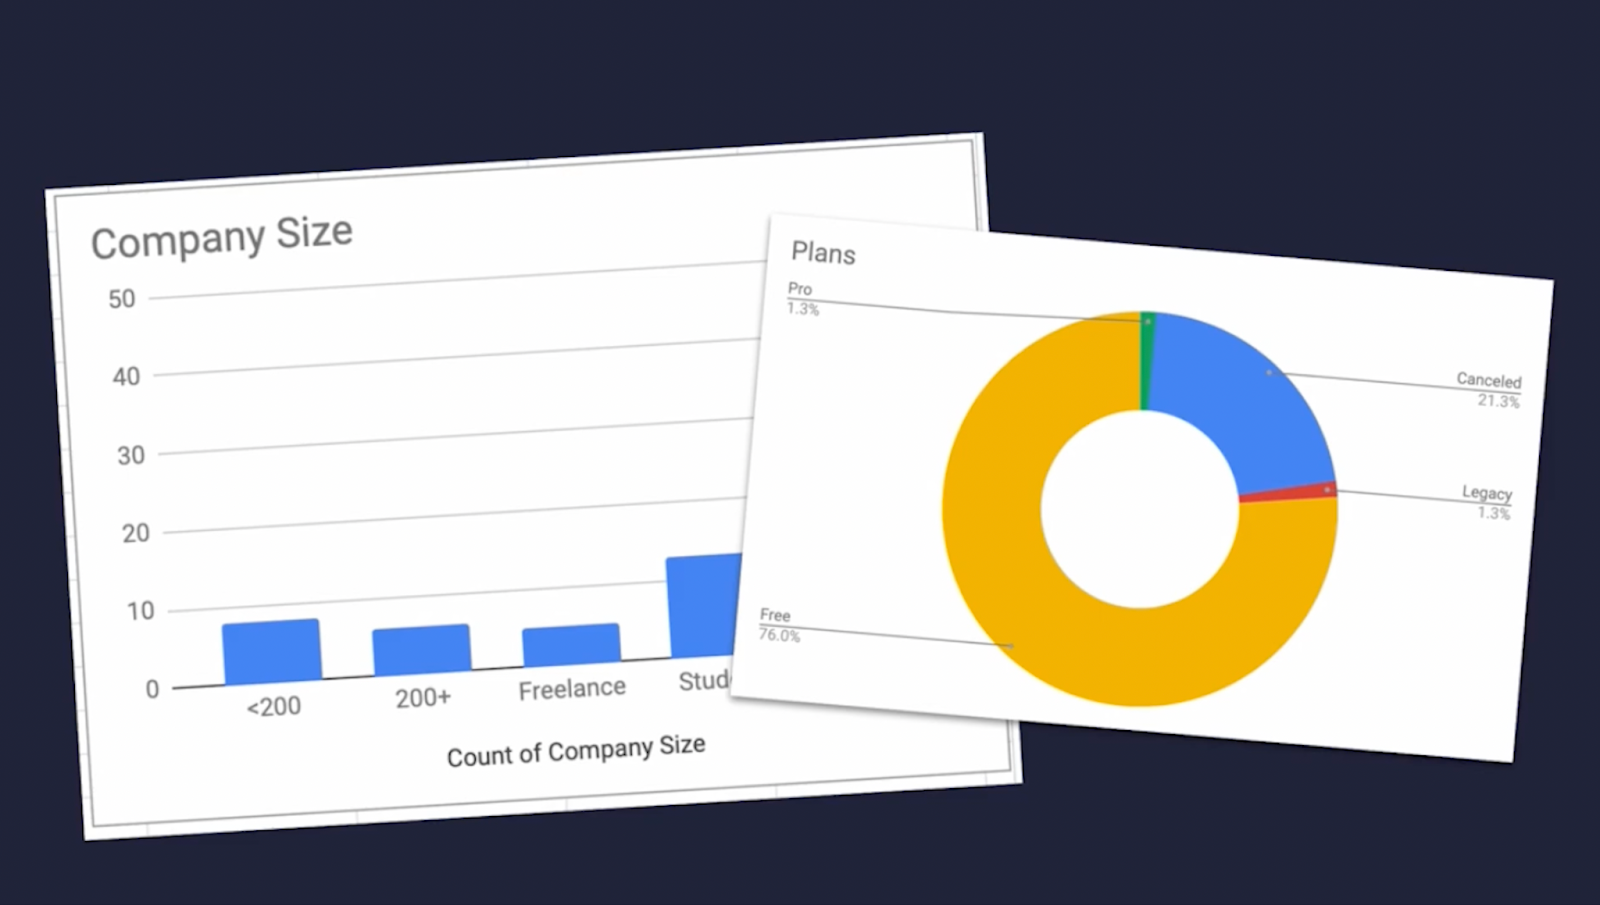
Here’s one I’ve recently worked through.
It shows all the sign-ups segmented by company size, which Netlify collected during sign-up.
What's exciting about this customer snapshot is that there's a gap. A lot of people who are our target persona never activate or experience the “Aha! moment.”
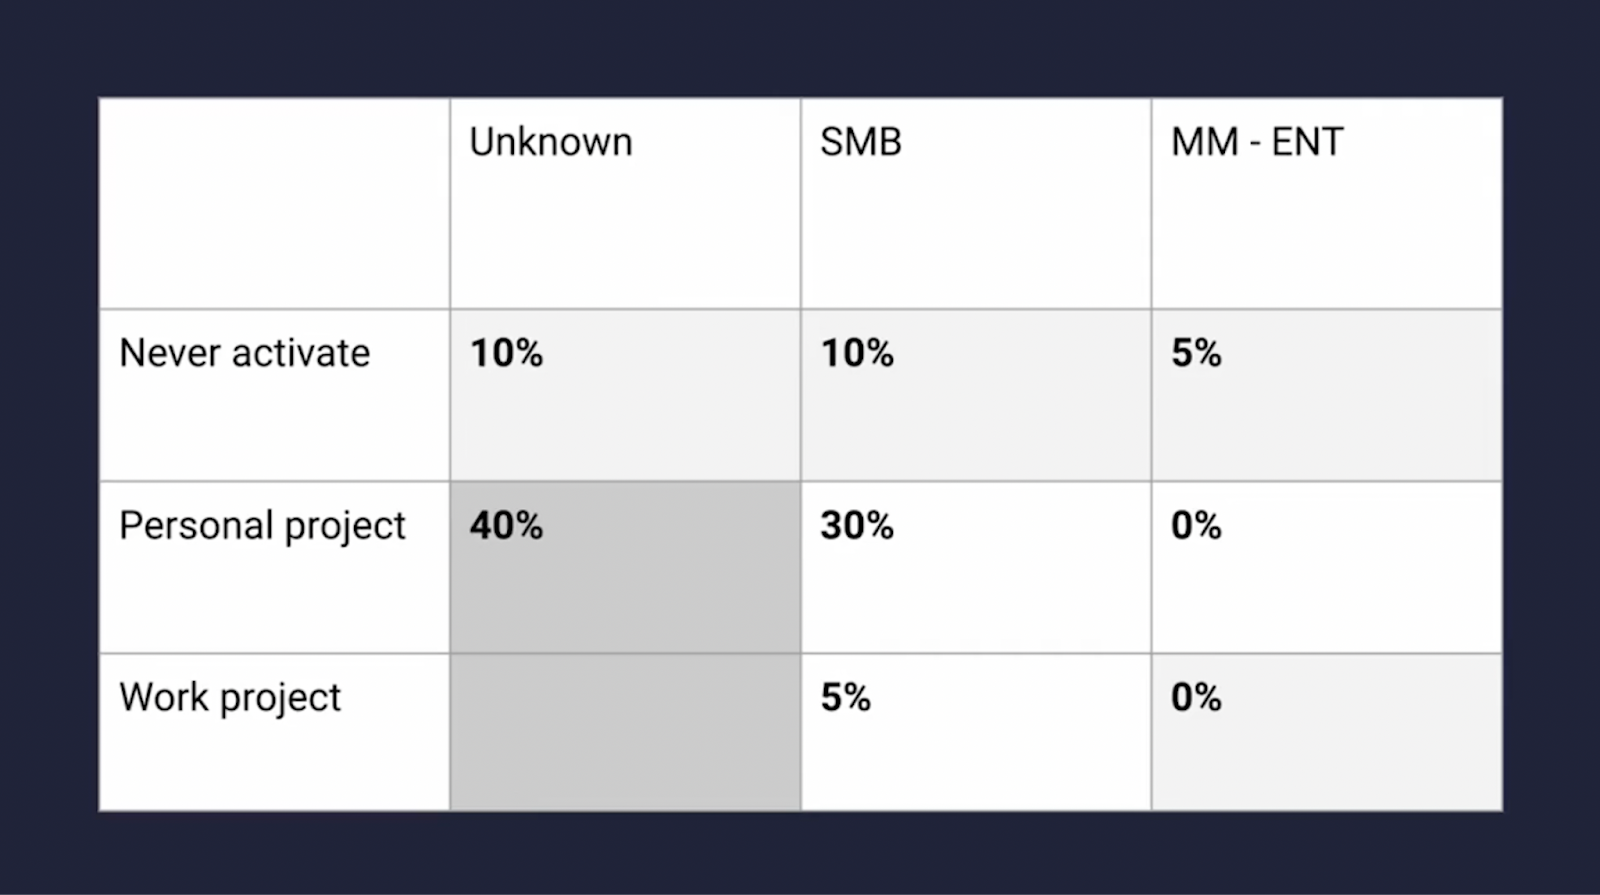
But this can be buried if you’re looking at the entire data set.
This customer snapshot helped me determine an opportunity that wouldn't have been found by looking at my KPI dashboard alone.
Don't be afraid to get your hands dirty.
Prototyping helps you align whether or not you have the right metric to measure at scale.
Reduce risk as you go to your data or product team. Stress the importance of collecting a customer snapshot for every single person who signs up.
As you can see from this article, SaaS user research goes hand-in-hand with collecting the right type of data to capture where a user is in the customer journey. By doing so, you have the ability to find gaps and areas of opportunity to skyrocket the growth of your product-led business.