A disjointed team will only result in confusion, inefficiency, and more overhead. It’s crucial to align around objective data to get clarity on the way forward.
First, organizations need to determine what key product-led growth (PLG) metrics are essential for growth. Then, they need to employ strategies to align their teams and work towards big-picture goals.
This is no easy task.
In this article, we’ll go over the five core actionable growth metrics for SaaS and how to align your team around them so your organization can grow steadily.
https://www.youtube.com/watch?v=-08FfHQmLh4
What Are SaaS Growth Metrics?
To successfully transition to a PLG model, organizations shouldn’t only attract new users but focus on retention and long-term customer relationships. To know what areas need work in your PLG structure, you need to understand your metrics.
A company can use SaaS metrics to track consistent growth. SaaS metrics function like regular KPIs in that they help companies measure the success of their organization and plan for a stable economic future.
Some useful SaaS metrics include:
- Churn
- Activation Rate
- Burn rate
- Customer Lifetime Value (CLV)
- Customer Acquisition Cost (CAC)
- Monthly Recurring Revenue (MRR)
- Net Promoter Score (NPS)
These are weaved into the “big five” actionable growth metrics below – this is where we’ll focus in this article.
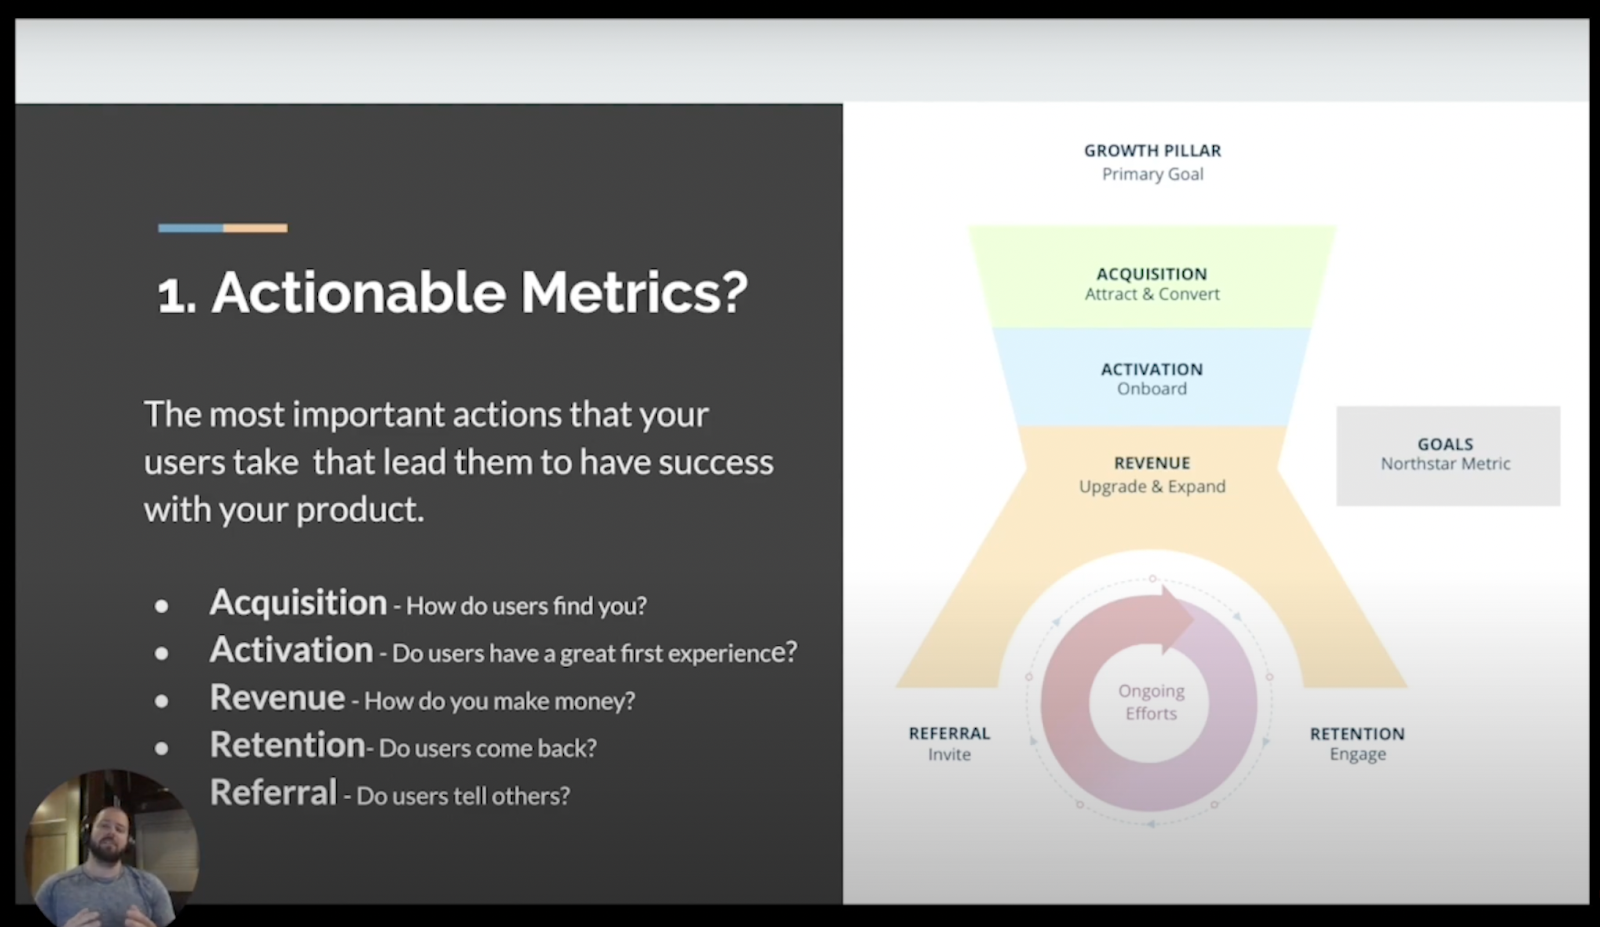
The 5 SaaS Actionable Growth Metrics
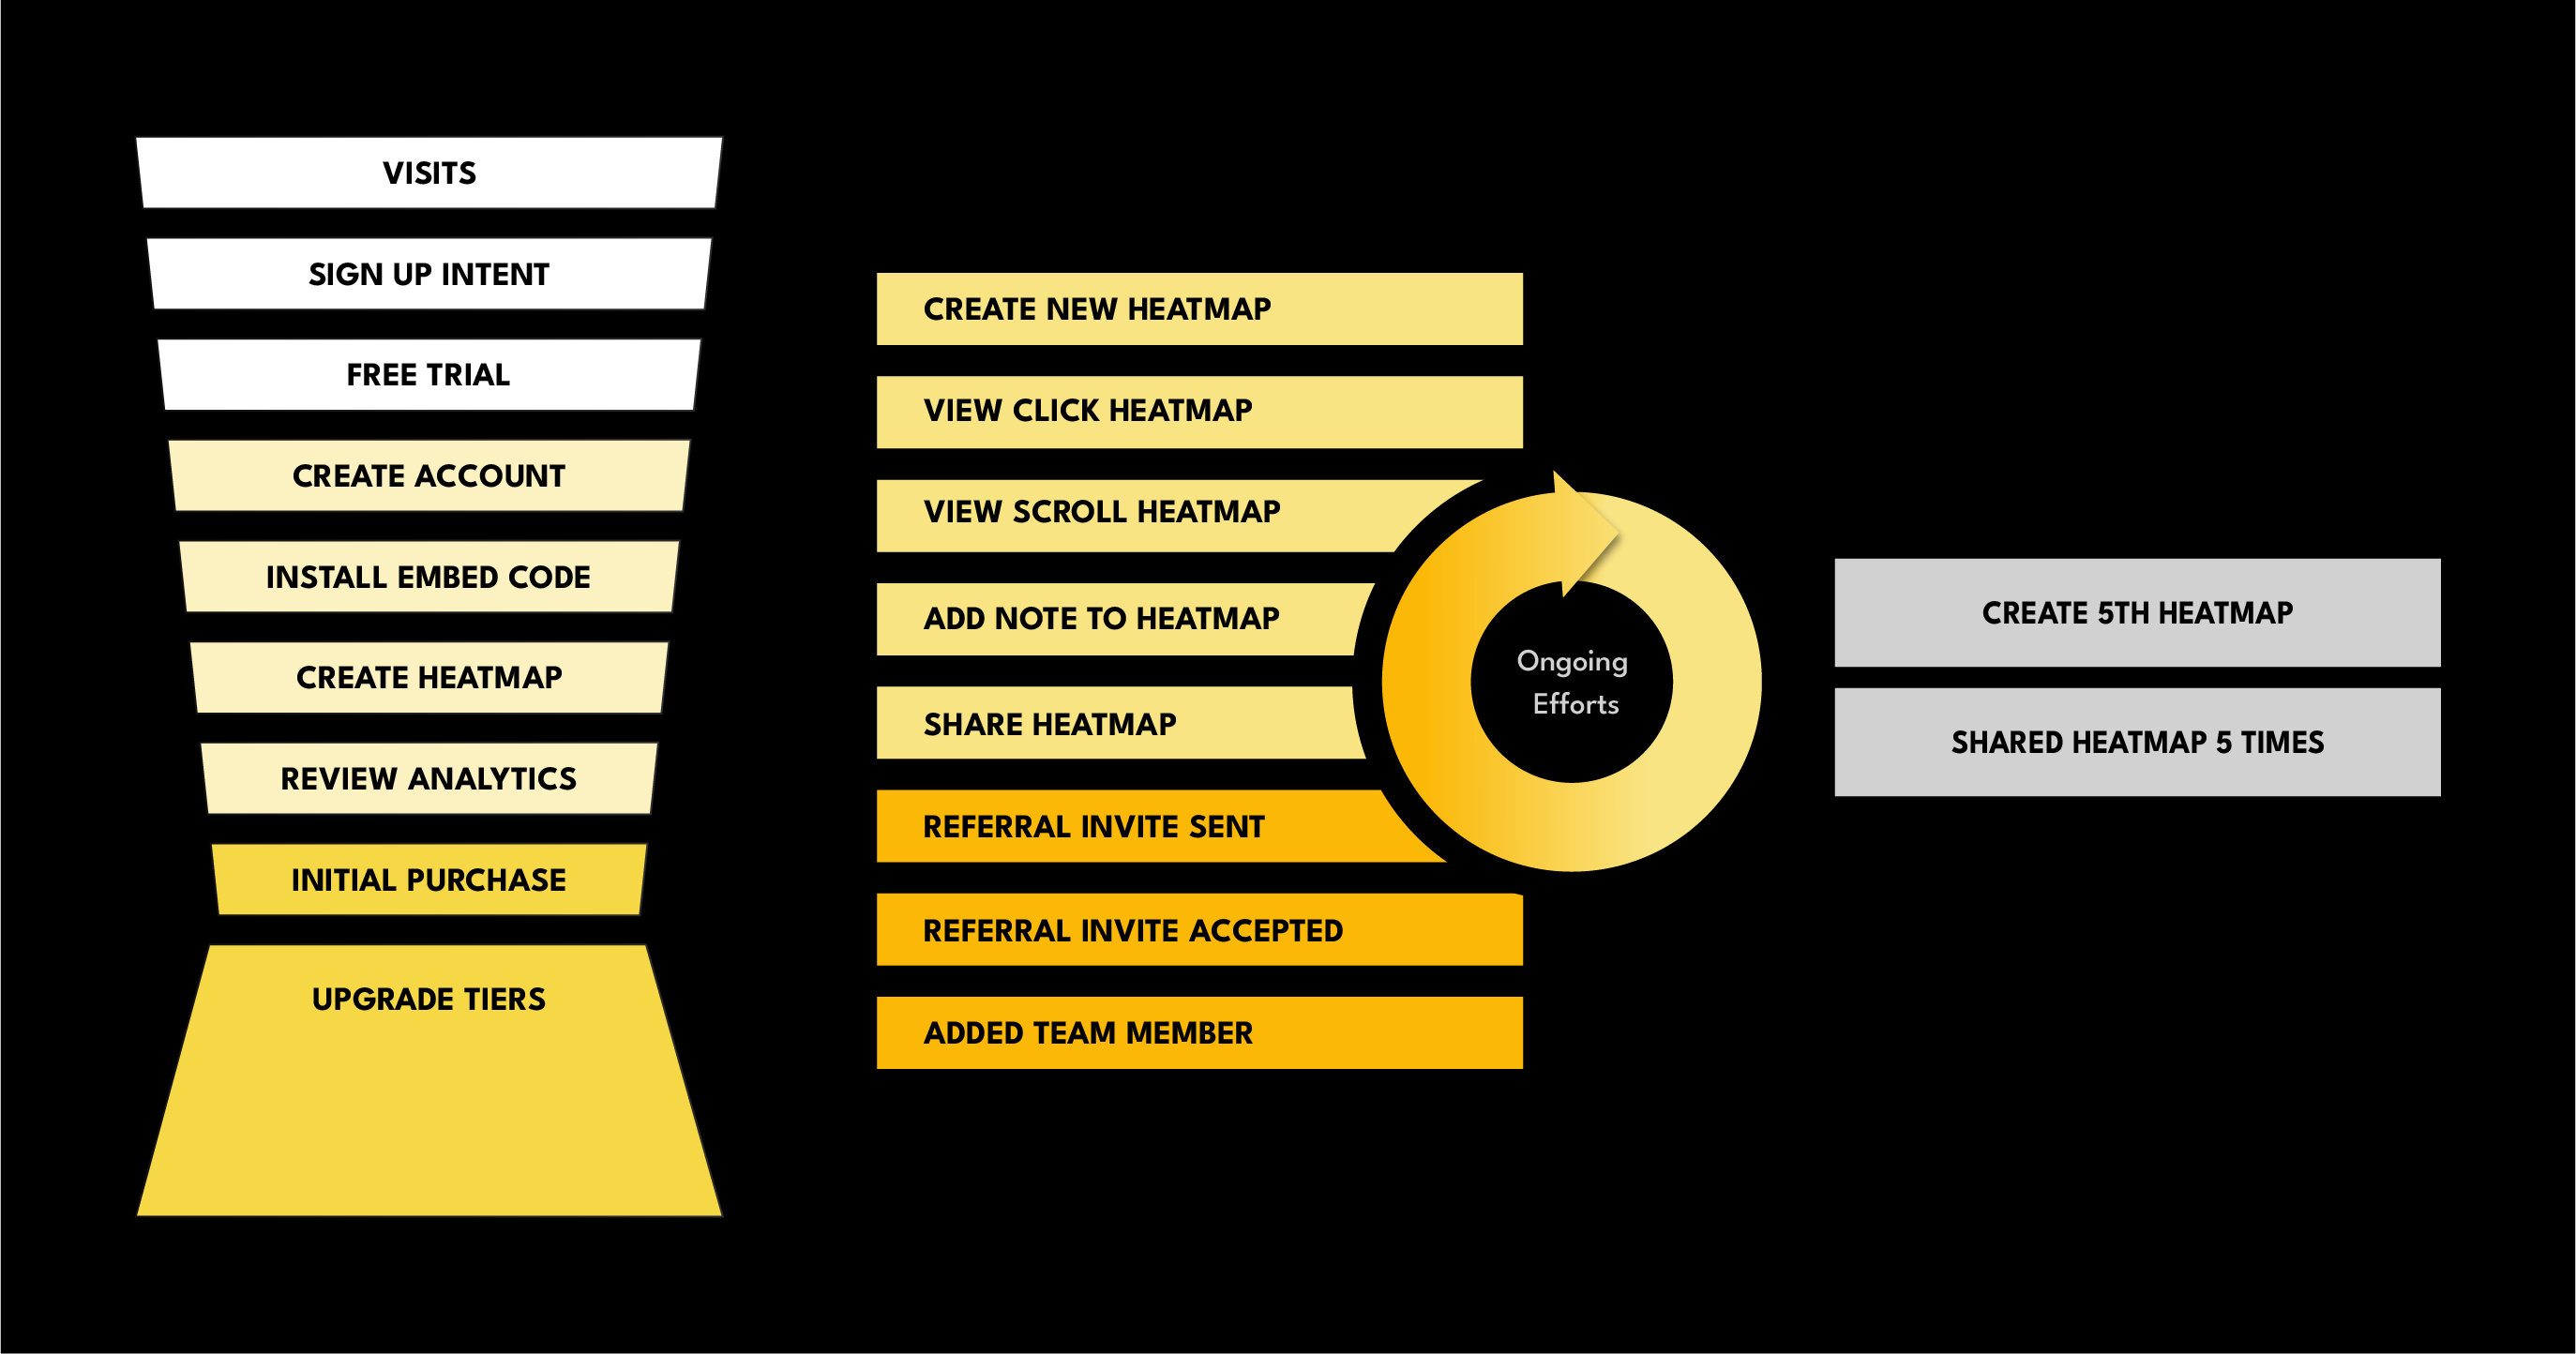
Acquisition, Activation, and Revenue make up the funnel, whereas Retention and Referral are ongoing efforts.
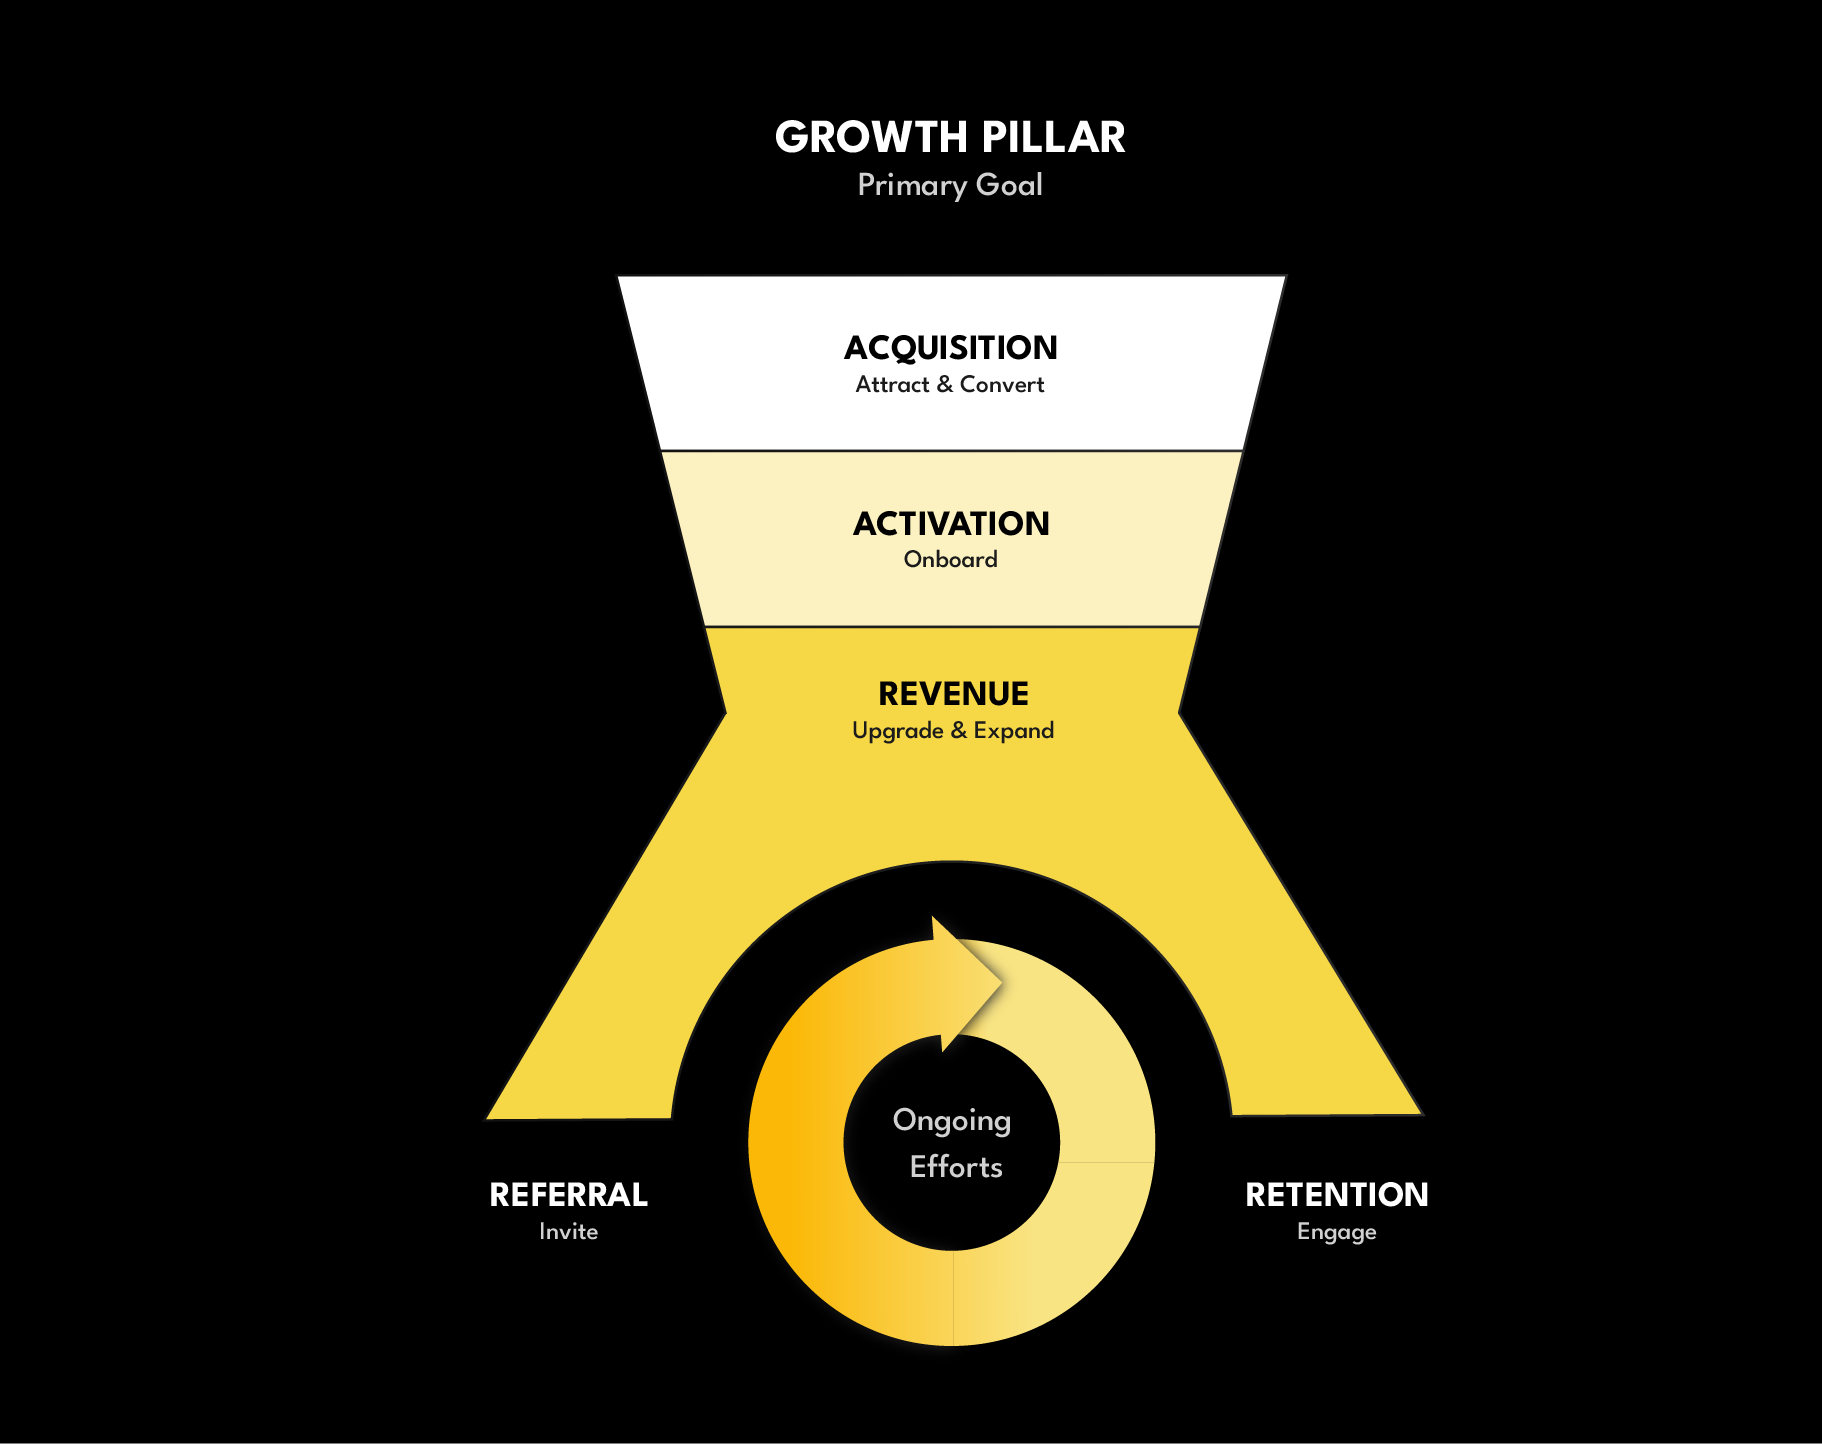
Goals move the organization towards your North Star Metric – this is a single metric that, when successful, will drive the highest value for customers.
The North Star Metric represents an organization’s core value.
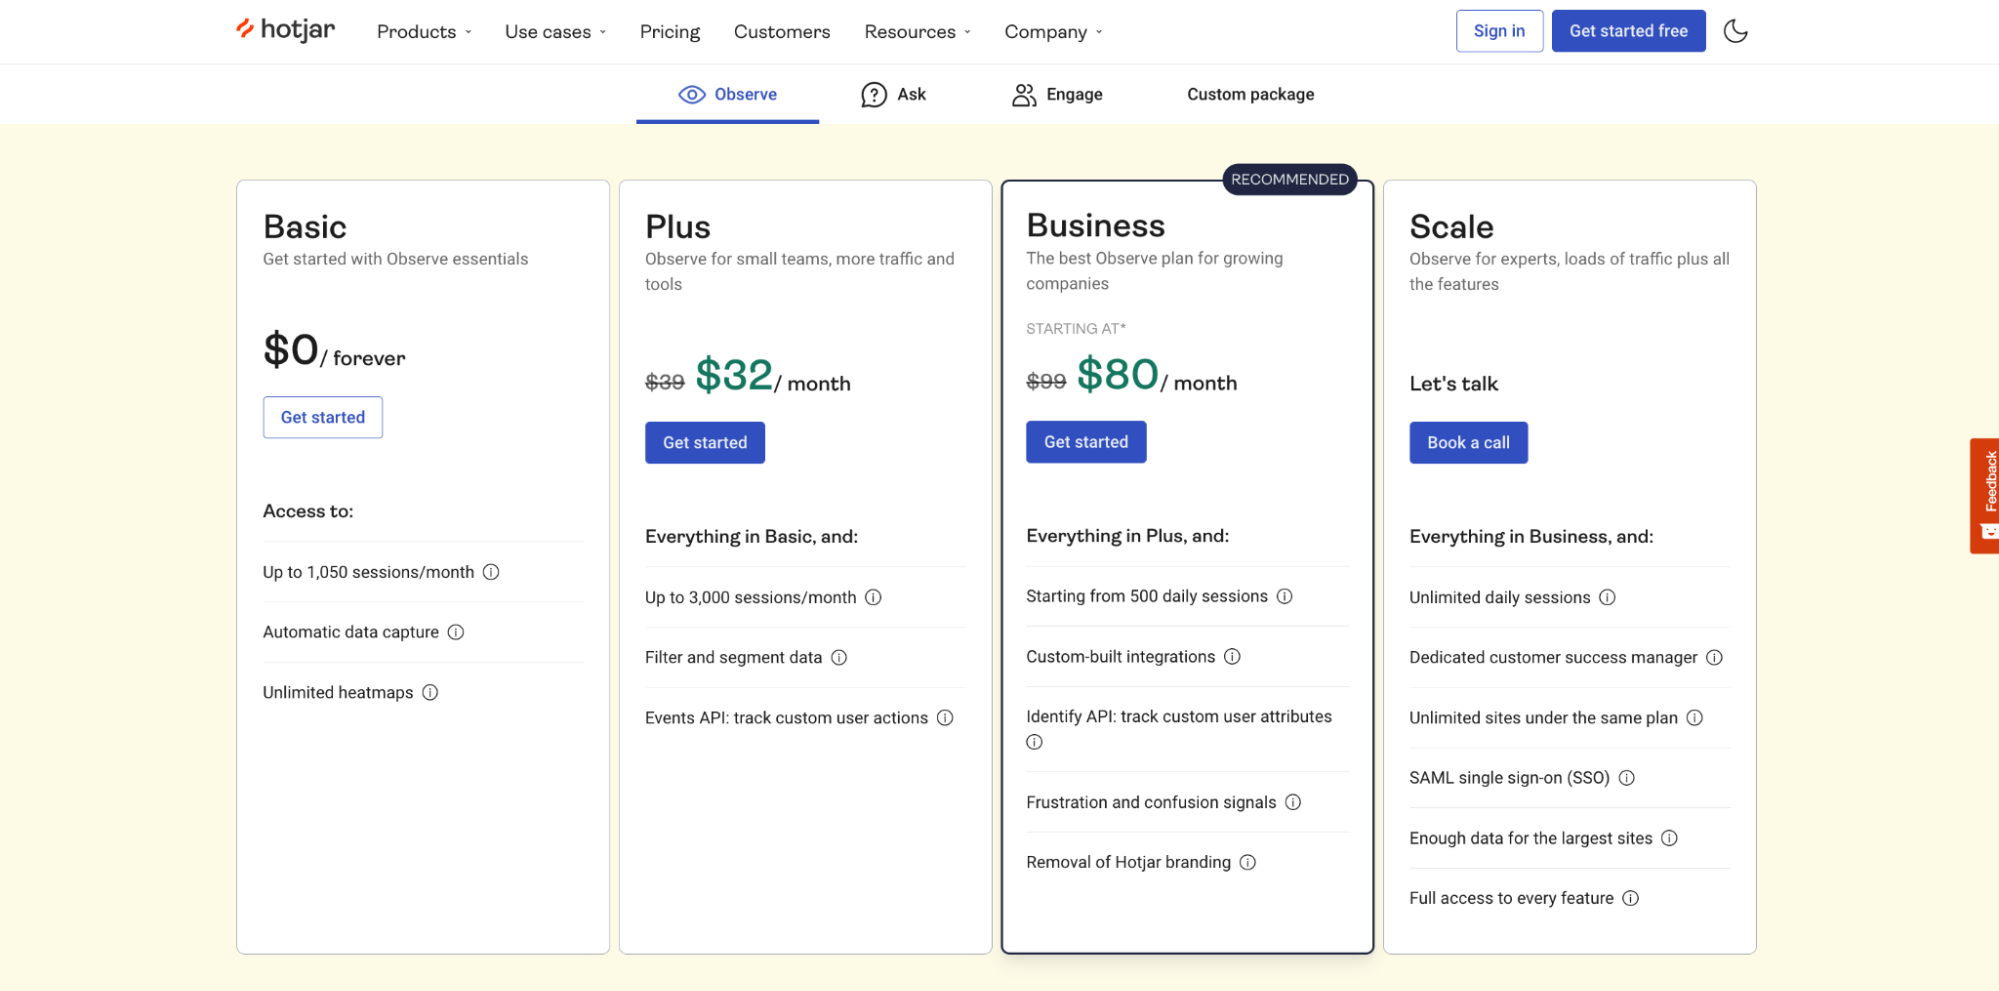
Let’s dive into these five actionable growth metrics, along with their primary and secondary metrics. I’ll use Hotjar as an example to flesh out the important points on SaaS PLG metrics and team alignment.
1. Acquisition
This is the first step in your funnel: where visitors find you online and sign up to begin exploring your product.
User acquisition is usually owned by Marketing and Sales, the top-of-funnel teams. That being said, PLG organizations leverage cross-functional teams to optimize acquisition.
Primary Metric
What is your customer acquisition strategy. Free trial, Free Sign Up or DemoSecondary Metrics
The other actions that lead up to getting the prospect to convert on the primary acquisition metric• Free Trial• Visits
• Sign Up Intent
Visits to Pricing Page
Started Registration
Primary Metric
The primary metric is your customer acquisition strategy – this is looking at the first kick-off in your product-led growth flywheel.
A product-led organization usually approaches acquisition with one of these:
- Free trial
- Free sign-up
- Demo
Your primary metrics are determined by how many people started the free trial, signed up, or engaged with the demo of the product. You can look at these separately if you have multiple funnels in your organization.
Secondary Metric
You can track the actions the prospect takes that lead up to conversion on the primary acquisition metric.
For example, check how many pricing page visits you have and how many visitors completed the action on the page. This can provide insight into where people drop off or actually make it through.
Defining sign-up intent is very important here. What was the motivation to start registration, and did they successfully do it? It could be a visit to your pricing page that led them to start a free trial. If so, how can you optimize that prospect journey for higher conversions?
2. Activation or Onboarding
Prospects are now using your product, so you need to help them quickly understand the value and how it solves their problem. And you need to make the experience personalized.
Salesforce found that 80% of people would rather do business with a company that offers personalization. In 2017 the report showed 52% of B2C customers switched brands if their experience wasn’t personalized.
Primary Metric
Primary action that delivers on the promise of your business.Your last user onboarding step.Secondary Metrics
The rest of the User Onboarding steps the assist in getting the user through the core steps.Review Heatmap Analytics• Create Account
• Install Embed Code
• Create Heatmap
• Test Embed Code is Installed
Primary Metric
This is the North Star Metric – you have to deliver on the promise of your business to successfully activate and onboard users. It’s the last step in your onboarding process.
For example, with Hotjar, the user would review their heatmap analytics as a final step in the onboarding process. This happens after the other required steps in the onboarding.
Secondary Metric
These are the rest of the user onboarding steps that become your checklist. The goal is to assist the user through the core steps to reach activation. For Hotjar, these include:
- Create an account
- Install the embed code
- Create a heatmap
- Test that the embed code is installed
Once they complete these items on the checklist, they have finished onboarding and can move to the next stage.
3. Revenue (Upgrade and expand)
If a user converts, they will subscribe to your tool and become customers. The more they use your product, the more they should be willing to pay for additional features.
Primary Metric
The initial action that drives new revenue.Secondary Metrics
What other action take place that lead to added revenue.Initial Purchase/Upgrade• Upgrade Tier
Personal = Basic to Plus
Business = Increase pageviews per day
Agency = Add Client
Primary Metrics
The primary metric here is the initial action that drives new revenue for your business. It is the first purchase or upgrade from the user that was successfully activated.
Secondary Metrics
Secondary metrics are the actions that lead to more revenue – your expansion metrics. These vary based on an organization’s product, target audience, and payment structures.
For Hotjar, users can upgrade within the tier they chose:
- Personal: Basic to Plus plan
- Business: Increase allowed pageviews per day
- Sale: Add a client to their account
4. Retention (Engage)
Users should now be coming back to your product and look to see increased value. If the product delivers, they engage with the product more and become one of your number one fans.
Primary Metric
The most important actions or activities within the product that when performed for the first time could possibly lead to greater retention or even become your north star metric.Secondary Metrics
Other actions within your product if performed multiple times by users could indicate greate retention. These are the actions surrounding your product’s main features.• Create 2nd Heatmap
• Create 5th Heatmap
• Shared Heatmap 1 time
• Shared Heatmap 5 times• View Click Heatmap
• View Scroll Heatmap
• Add Note to Heatmap
• Download & Share Heatmap
Primary Metrics (Goals)
Users are now engaging with the most important actions or activities within the product. When performed for the first time, they could lead to greater retention or become your North Star Metric.
Whatever the action is, you are looking at the impact to understand the most important or impactful. For Hotjar, they could look more closely at these metrics and determine their impact:
- User creates 2nd heatmap
- User creates 5th heatmap
- User shares heatmap 1 time
- User shares heatmap 5 times
The key is to pay attention to which of these would have the greatest impact on retention.
Secondary Metrics Feature
These secondary actions within your product could indicate greater retention if users perform multiple times. These are the actions surrounding your product's main features.
Hotjar’s secondary metrics include:
- View click heatmap
- View scroll heatmap
- Add note to heatmap
- Download and share heatmap
PLG teams can track these features and understand which are being used most, driving better retention, and so on.
5. Referral (Invite)
In the most favorable conditions, users are loving your product and start sharing it with their network of friends, colleagues, and co-workers.
Primary Metrics
The most important actions related to sharing your product with others.• New Referral Invitation Sent
• New Referral (Invitation Accepted)
• Add New Team Member
Primary Metrics
These are the most important actions related to sharing your product with others. For many SaaS companies, including Hotjar, that could look like:
- New referral: invitation sent
- New referral: invitation accepted
- Adding a new team member
These metrics measure the ongoing efforts of retention and the subsequent referrals from users. While the funnel helps you understand engagement (your active users), the “ongoing efforts” narrows down the understanding of your North Star Metric.
If you notice that action drives higher retention and customer lifetime value, it’s time to rally teams around that new North Star Metric.
Metrics are the point product-led growth teams need to align around to optimize for greater retention and more referrals.
How to Align Your Team Around Metrics?
A report by Forrester concluded that businesses with proper alignment see a 32% increase in revenue growth. While businesses with less will see a 7% decrease. Only 8% of these companies say that their marketing and sales teams are aligned.
This is the gap between success and failure. Get alignment right, and you will succeed.
Organizations need to determine which team is responsible for each of the key metrics. A person on that team is usually responsible for addressing any challenges or “owning” that metric.
Here are four important questions to address before moving forward with PLG metrics:
- Where will these metrics be tracked? Often, teams are misaligned on where everything is tracked and integrated.
- What are the strategies to grow these metrics? If you've defined them, how will teams grow them?
- What are the gaps? A tech stack might be needed to support this critical question.
- And finally: Is your team aligned?
Once you silo your actionable metrics, you will need to define which teams are responsible for growing them. This gives people a clear vision as to which teams and individuals are responsible for the metrics.
Who on the Team Owns the Metric?
By assigning somebody your key PLG metrics, you’re kickstarting proactive growth. This approach will ensure your metrics are growing in the right direction or determine if changes need to be made.
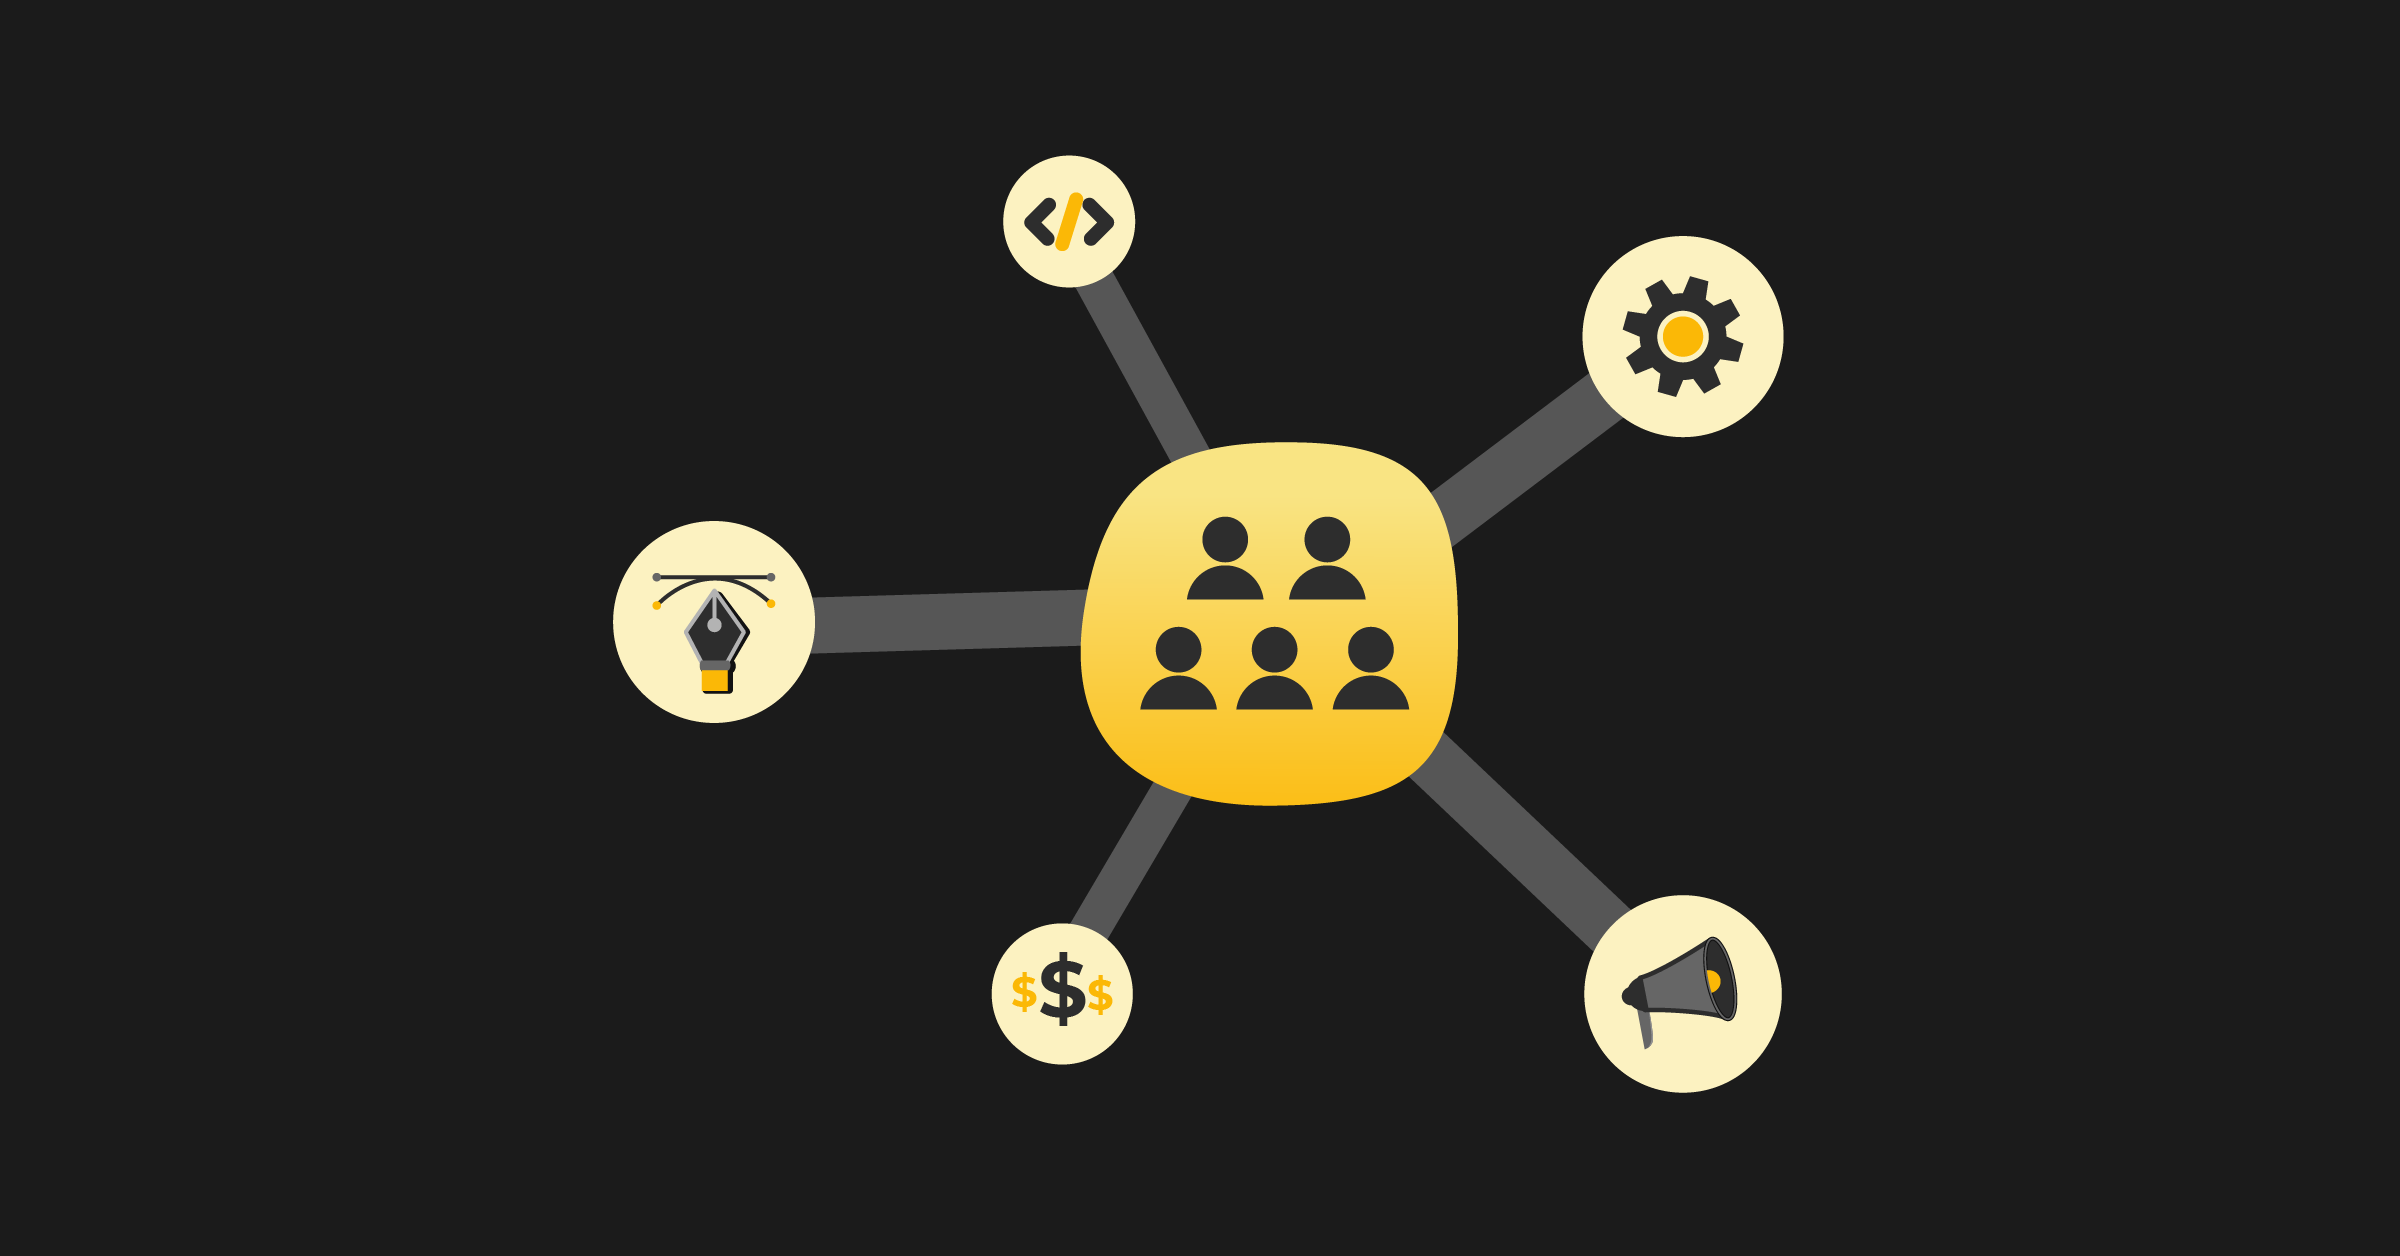
AcquisitionActivationRevenueRetentionReferral• Marketing
• Sales• Customer Success
• Sales
• Marketing
• Product• Sales
• Customer Success
• Product
• Marketing• Customer Success
• Product
• Marketing• Marketing
• Customer Success
• Product
If each of your acquisition metrics is defined, you can assign a team member to be responsible for that metric. For example, the free trial metric would have one person responsible for making sure it’s growing and hitting goals.
Make an individual responsible for each one of these defined metrics.
As you have team meetings, you can determine if it’s going in the right direction. You can also determine if there are data validation issues and catch those before they become a problem.
Where Will the Metrics Be Tracked?
To enable cross-functional teams, the organization must clearly align and inform them of all key PLG metrics locations. Everyone should know where the metrics are and how the metric they own helps create a bigger picture.
AcquisitionActivationRevenueRetentionReferral• Google Analytics
• Hubspot
• MailChimp• InnerTrends
• Mixpanel
• Fullstory
• Hotjar DB• InnerTrends
• Stripe
• Hotjar DB• InnerTrends
• Mixpanel
• Hotjar DB• Ambassador
• InnerTrends
• Mixpanel
Data visualization can help create a clear understanding of the actionable metrics. Ultimately, the goal is to keep everything organized clearly so that teams can see how their individual parts integrate into the larger goals of the business.
What Are the Strategies to Grow These Metrics?
Start by looking at PLG metrics individually and agreeing on which specific ones are the most important ones for their relative stage in the growth flywheel. Then talk as a team and honestly assess what worked and what didn’t.
Having conversations with the teams on the ground, and owning the metrics, will help bring clarity to what needs your focus. Then brainstorming strategies and steps become more meaningful.
Here are some key strategies to consider in each stage of the growth flywheel:
AcquisitionActivationRevenueRetentionReferral• Inbound Marketing
• Paid Advertising
• Cold Outreach
• Account-based Marketing
• SEO
• Growth Hacking
• Social Media
• Partner Program•Walkthroughs
•Checklists
• In-App Messages
• Triggered Emails
• Drip Sequences
• User Engagement
• Tracking
•Product Updates• Pricing Strategies
• Free Trials
• Demos
• Sales Enablement
• Content
• Phone Calls• How to Resources
• Webinars
• In-App Messaging
• Feature Additions
• Engagement Tracking
• Training Courses
• Customer Surveys
• Product Updates• Affiliate Program
• Referral Program
• Product Invite Features
Diving into these as a team will bring forth any gaps that you have, and what you need to concentrate on moving forward.
What Tools Are Needed to Execute the Strategies?
Looking at a tech stack and understanding what tools you need to execute is always a challenge.
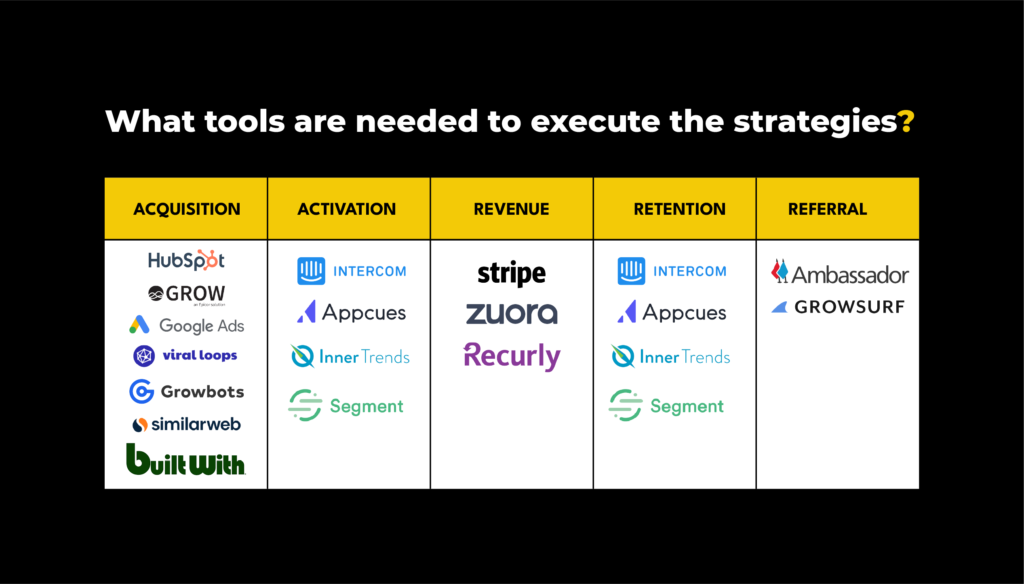
Look at what tools you have for growing your strategies, tracking, and so on, and what tools you'll need. You can do some research if you’re missing any tools to track growth on certain metrics.
Track your progress
Tracking your progress is how you'll actually have data-driven growth. I suggest creating a tracking dashboard and creating team scorecards. Holding your team accountable for their growth is key when focusing on the analysis of the metrics.
Create a Tracking Dashboard
Finding a tool that aligns perfectly with your actionable metrics is a great start to creating a meaningful tracking dashboard.
Use a BI analytics tool to automate the visualizing of your organization’s actionable metrics. This will help your team quickly see trends and identify metrics that could indicate growth trends or issues.
Once your goals are set up, you’ll be able to monitor whether your teams and organization as a whole are hitting them. You can also easily incorporate your team and company scorecards into this visual dashboard.
Create a Company Scorecard
The Company Scorecard is used by the leadership team to track the primary metrics and see a bird's eye view of company growth. This helps point out essential focus areas.
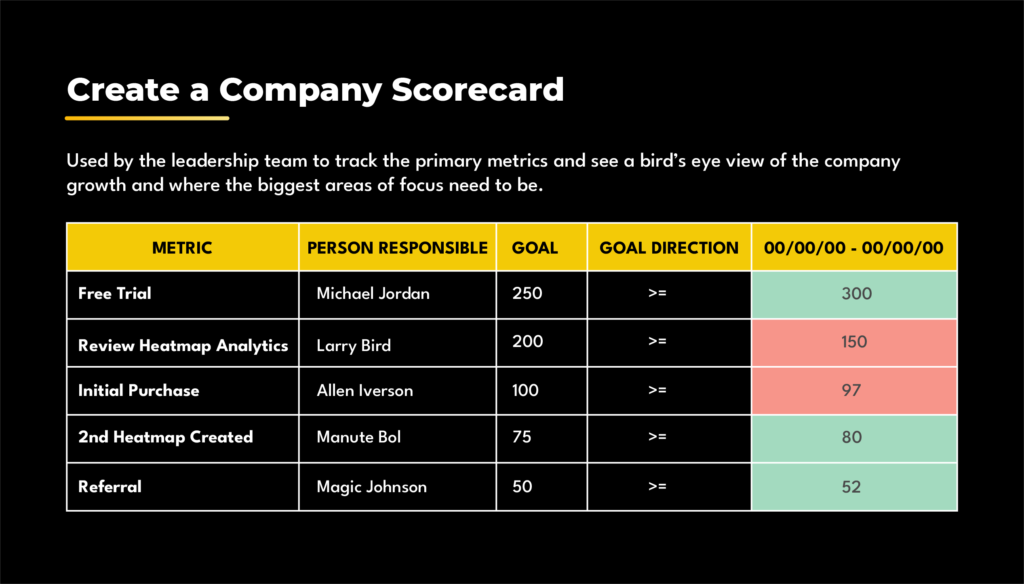
The Scorecard explained:
Each of your metrics is defined and color-coded as acquisition, activation, revenue, retention, and referral.
For instance, Michael Jordan is responsible for the Free Trial and has a goal of 250. It's greater than or equal to his goal by the time we have our weekly meetings (seen in green).
Now we can look at what we achieved in a specific timeframe and whether we hit the goal.
Using this framework, you'll start to see trends of whether you’re hitting certain goals or if some metrics are being missed. This provides a big-picture view as to how you’re growing your business and who's responsible for it.
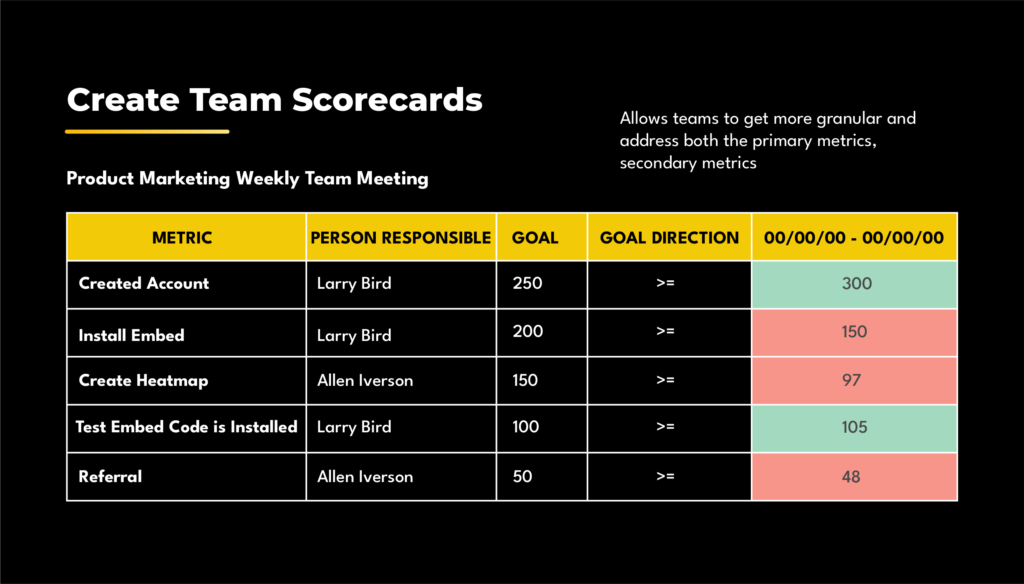
Create Team Scorecards
The Team Scorecard allows teams to get more granular and address both primary and secondary metrics. Teams need to understand where there are gaps and problem areas in growth.
With team scorecards, you can get more granular and also assign specific numbers around the most important tasks that help grow these metrics for each teammate.
Questions can come up:
- Are you missing out on a metric that we should be growing?
- Did we define the metric properly?
- Is there a team that's weaker than another?
For example, determine strategies based on monthly meetings with each department lead. This can show you which teams need help from leadership in different areas.
By holding ourselves accountable, it allows teams to clearly understand where we need to put concentration on growing the most important metrics.
Identify Opportunities
Many organizations start by building out a tracking dashboard and determining movements in the metrics that indicate growth or decline. But it’s important to go deeper.
Get answers to growth with more insightful and thoughtful questions around your actionable metrics:
- How many users became paying customers that completed User Onboarding (Activation) vs. those that did not?
- Which retention action, when completed, is leading to the highest value customers?
- What other actions are highly engaged users doing vs. those that are not?
It’s time to think like a data scientist and use each point as inspiration for a new question. It helps to have a great tool/system that allows you to dig deeper into the data to understand true opportunities.
What’s the First Step Your Organization Can Take to Become Aligned Around PLG Metrics?
Finding the right PLG metrics to track can be a feat in itself. It’s smart to think ahead to how you will start aligning your organization around them so impactful metrics don’t get stuck in a silo or left untapped.
Aligning your team is one key part of building a successful SaaS product, and it’s connected to every aspect of your business. In ProductLed’s four-week ProductLed Accelerator program, we get all your team members aligned.
The cohort-based program provides all the tools you need to launch a product-led growth strategy that fits your product. Even if your product is already in the marketplace, we can help identify the areas you can experiment with to increase market adoption.
Boomi, a $4 billion integration platform, transitioned to a product-led go-to-market strategy using our framework. Here’s what they had to say about the ProductLed Accelerator:
The course is so comprehensive and the ideal training tool for a newly established product-led culture. It helped us create a shared language.
When you sign up for the ProductLed Accelerator program, you get:
- Full access to the 4-week live online program that covers the steps to implement product-led growth.
- Unlimited 1:1 feedback for 60 Days via Slack with ProductLed Coaches for concrete feedback.
- Private Slack community for class discussions with your cohort.
- Frameworks and templates that help you apply the training to your business.
Take our free PLG certification course now, or sign up for our next live training program. You can also get your questions answered by peers and experts when you join the world’s largest product-led growth community on Slack.