Product-led growth (PLG) is an end-user-focused growth model that relies on the product as the primary driver of customer acquisition, conversion, and expansion.
It’s the purest, most profitable SaaS model and trades at two times the revenue multiple of other SaaS companies.
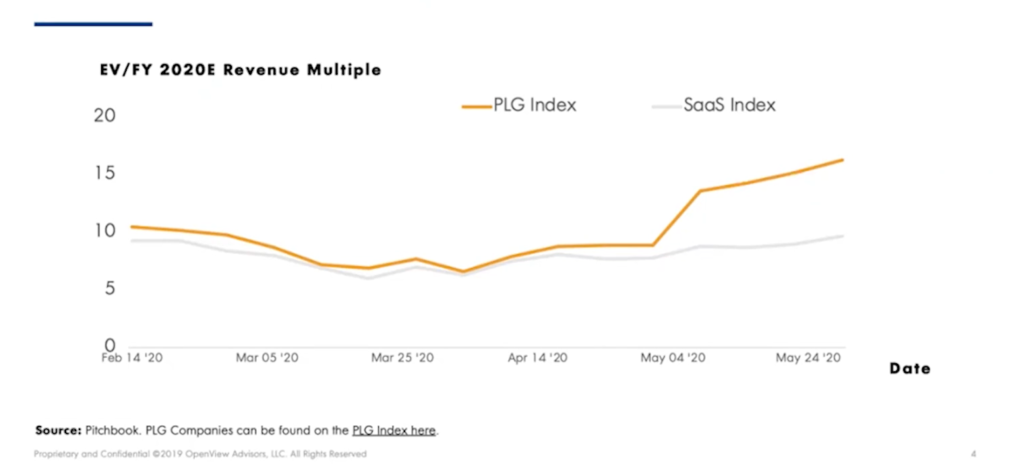
The bottom line is product-led growth companies perform exceptionally well financially. And this is backed by the success of many companies whose services we all use daily.
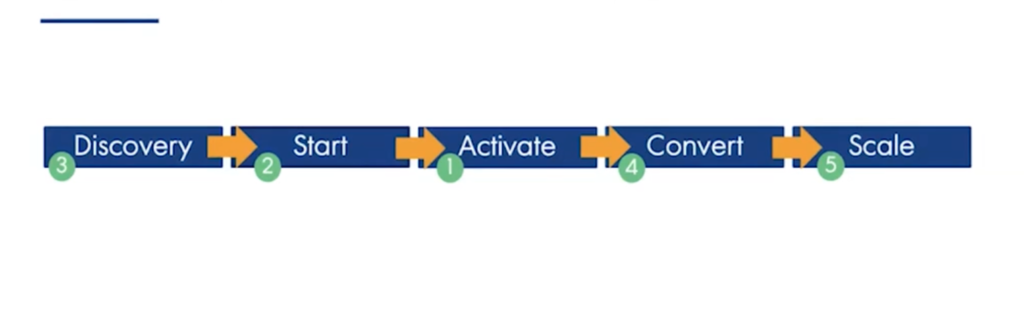
Based on interviews with 50+ folks from product-led businesses (early-to-late stage), we built this framework that helps PLG companies reach new limits. It consists of five stages, which we will touch on in this article.
- Activation
- Start
- Discovery
- Convert
- Scale
Before we start, keep this in mind
As with any business, all frameworks apply to a certain extent. While this framework is a practical guide, hard work & grit is necessary to get results.
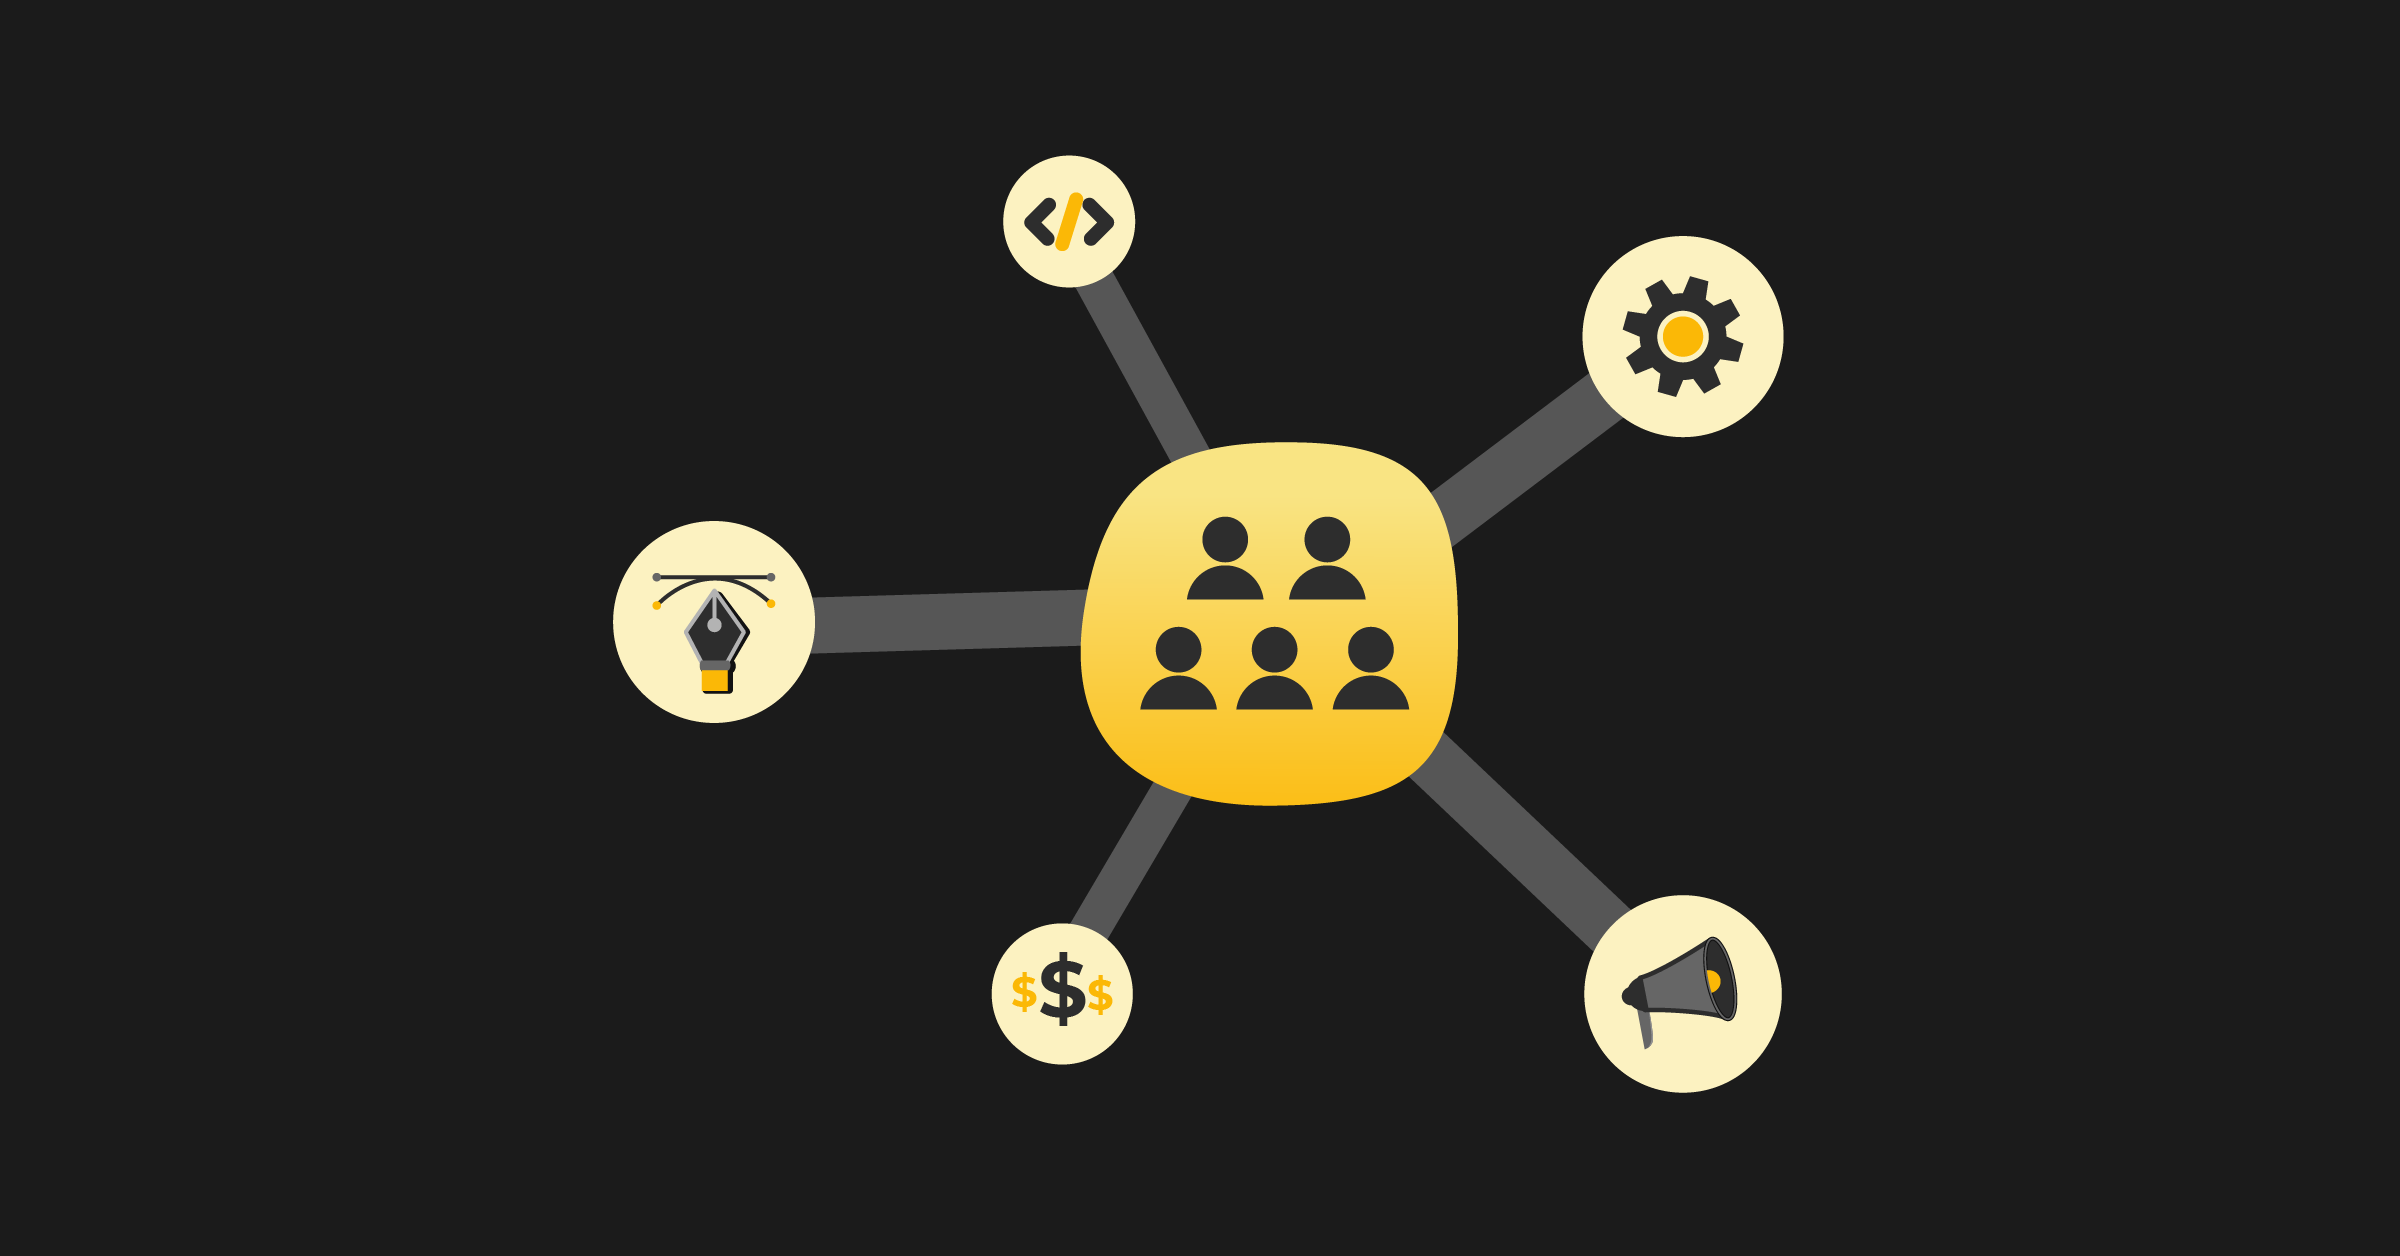
One of the main things that all successful product-led businesses focused on for growth was honing in on their market and their end-user.
The product-led framework follows the customer journey but really emphasizes and starts with value discovery.
#1: Activation
Activation is the critical moment driving your product's growth. It’s the moment when your product delivers on the promised value. Or the moment a user experiences the “aha” moment.
But how is activation defined for your product?
Unfortunately, there's more than just getting people to sign up. Currently, 40% to 60% of all users who sign-up for a free tool never return.
What is your Activation? A download? Is it using your tool for a certain period? Is it uploading a video? Or are you deploying an end-product?
If your product falls into the statistic above of 40-60% of users churning after signing up, that’s typically symptomatic of a product missing 1 of 2 key elements:
- Activation metric.
- Activation isn’t baked into the product (which is worse).
1. What Activation Metrics do PLG companies use?
There are 4 categories of Key Activation metrics (and corresponding benchmarks).
- Multi-user Products: Average activation of 20%
- Teams Products: Average activation of 20%
- Single-user Products: Average activation of 40%
- Browser Extensions: Average activation of 50%
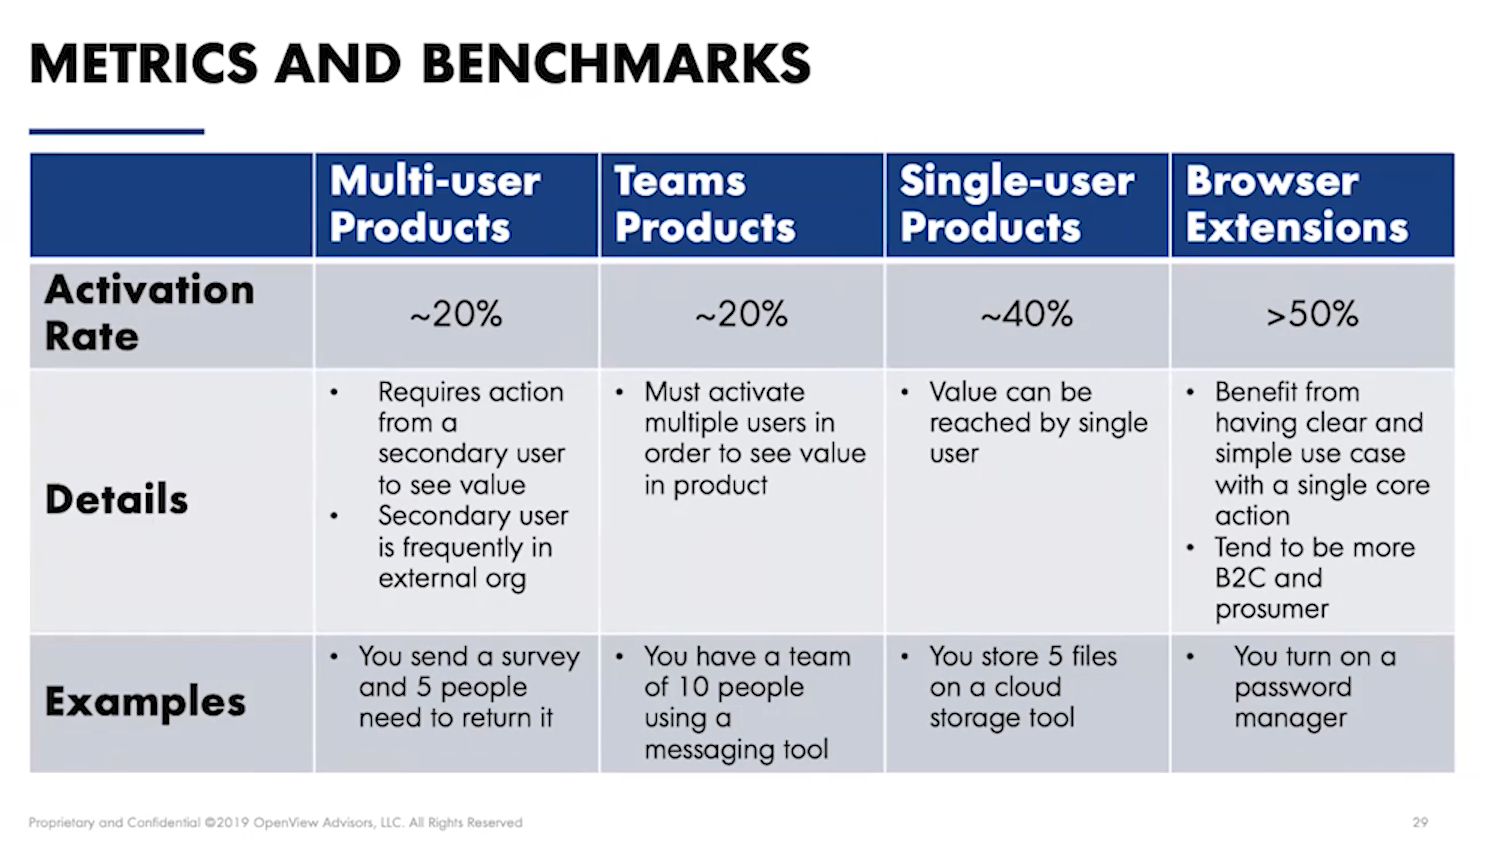
As you can see, products that have team collaboration baked into the tool, such as Mailchimp or Slack, have the lowest activation average at 20%. Single user products, like dropbox, averages around 40%. And browser extensions, such as Grammarly, have the highest activation rate at 50%.
Defining Activation for your company can be difficult, which is why we've provided a framework to help synthesize large amounts of data in three simple steps.
Step 1: Define your metrics for Activation.
- Is it a user addition?
- Feature usage?
- Positive responses?
Step 2: Have a clear definition for each metric.
- Is there an ideal number of users added to influence conversion or prevent churn?
- Is there a sweet spot in the number of feature usages that indicate a propensity to convert?
- Are there several positive responses that generally lead to conversion or churn early on?
Step 3: Ask yourself the following four questions:
- Is it easy to achieve by the average user?
- Can it be completed relatively quickly?
- Is it predictive of user retention?
- Does it correlate to business performance?
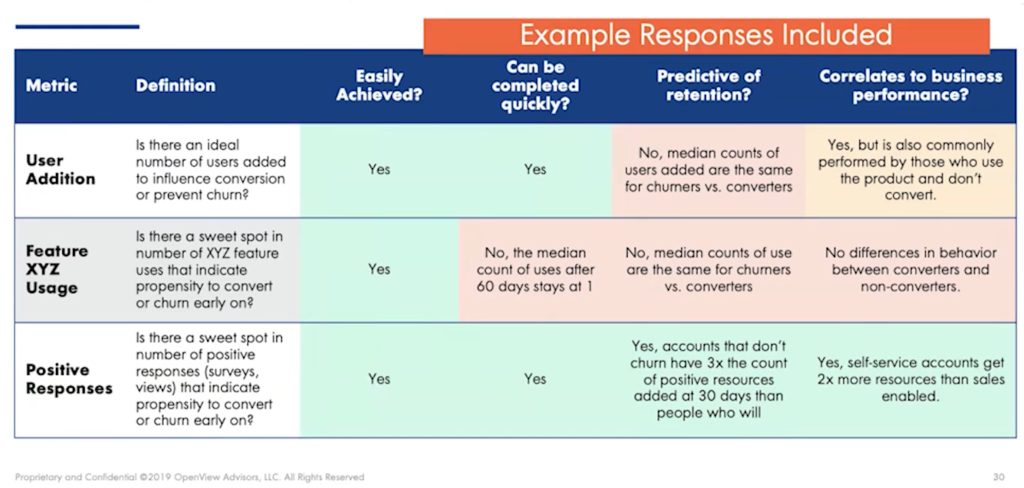
Once you follow the steps and answer all the questions, you can collate your findings in a worksheet to help you synthesize data and define what Activation means for your company.
#2: Start
The Start phase is the bridge that connects the discovery and usage of a product. This connection is when the user decides to input their information and give your product a try.
Some drivers lead a user to get started, and these drivers make up a message about your brand and the experience it provides.
Here are three ways to drive the Start phase:
- The messaging of your product
- Your website design
- The web user interface (sometimes)
When you think about the Start Pphase, the website is one of a user’s first touchpoints. Therefore, the website should answer this burning question, “How is this product going to make me better?”
It should be aspirational, and that comes down to the brand.
Let’s use Slack as an example of how a company can evolve its message.
In their earlier days, Slack tried to find a user interface that gave an aspirational message and helped users understand who they were.
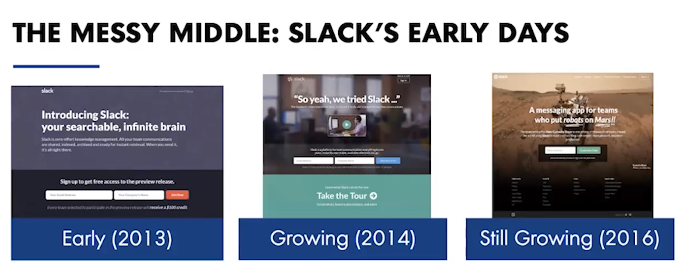
2013: Slack introduced their product as “your searchable, infinite brain.” Most likely, that phrase didn’t appeal to people. And it didn’t help people understand what Slack was or how it could help them. At this point, Slack maybe didn’t know who they were either.
2014: they started playing with customer stories to build a “hero” storyline to make people feel like a hero.
2016: the team took a shot at an aspirational storyline but used jargon that may have alienated new users.
2020: they figured out how to turn the user into the hero and stressed the value of relationships and communication.
The point is that Slack was never as perfect in the past as they are today. Finding the sweet spot where your business is dialed-in for brand messaging and the message feels aspirational to the user takes time and work.
How did Slack get here?
By constantly using metrics and benchmarks to see how well their brand performs.
But what do those metrics look like?
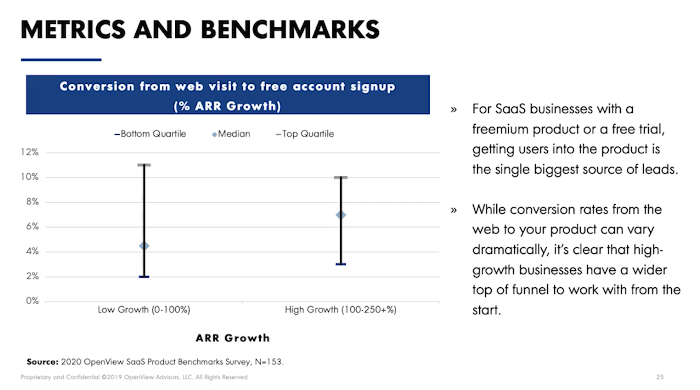
The most potent metric you can use for brand success is converting website visitors to free account sign-ups.
Conversions can vary dramatically depending on the size of your target market, how hard it is to get into your product, or how many leads come to your website.
But it’s proven that high-growth businesses have a wider top funnel to work with from the start.
How to Message for Your Solution
The ultimate goal for your messaging is to communicate the problem your product solves and why the user needs it (their pain point), so they, in turn, sign up for your product.
Here are five insights to help message your solution for user pain.
- PLG websites revolve around people, not product features. Users want to know how your product will make them look good. That’s all that matters.
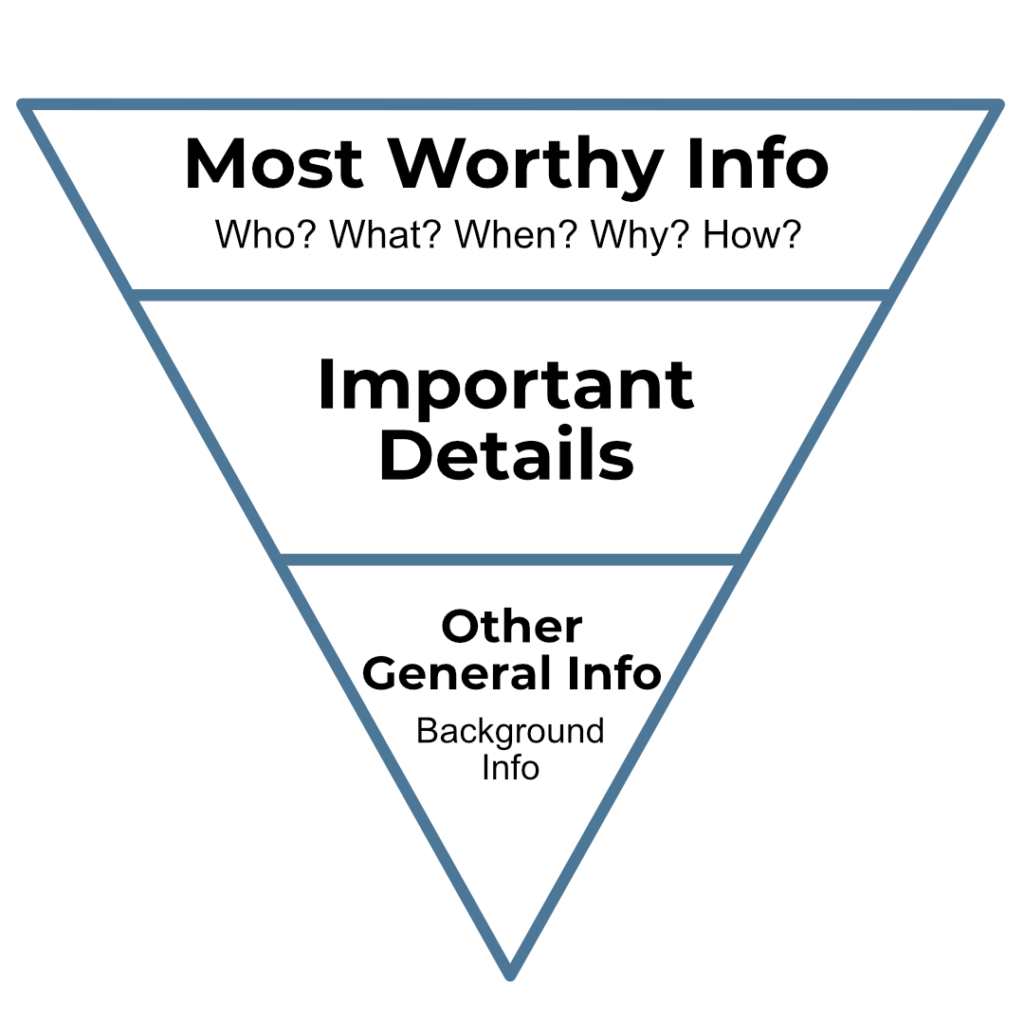
- Great websites use an inverted pyramid to tell their story. The most critical, convincing line of copy that answers, “Why this?” must go at the very top. All of the copies below should answer a common question and convince skeptics.
- Show, don’t tell. When possible, show the product in action using a video or animation that plays on page load and loops.
- Design should also be people-focused. For example, using photos of real people makes it easier for potential customers to picture themselves using your product.
- FOMO is real. Messaging must imply that the most intelligent, most in-the-know people in the industry rely on your product—and if you want to keep up with them, you’ve got to get on board.
#3: Discovery
Discovery is how users find your product. Most businesses focus most of their time on the Discovery Phase; however, it’s the third most important part.
Wait a minute, why isn’t it the most important?
Users can find your product, but they will walk away if they don’t see the value or understand how to Start.
But how is Discovery happening for product-led businesses, especially in the early stages?
Here are three ways it happens:
- Organic discovery by early adopters.
- Drop-in via collaboration/virality.
- A need that is felt powerfully by a user who discovers the tool.
Understanding your product’s communities, their needs, and who will be an influencer is vital in getting your product adopted.
Here are some tactics you can use to attract different users.
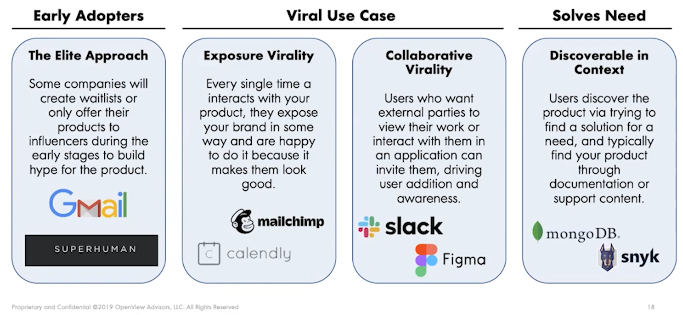
Early Adopters
- The Elite Approach: some companies will only offer their services to influencers, or they’ll create a waitlist. An example is Superhuman.
Viral Use Cases
- Exposure Virality: every time a user interacts with your product in some way, they expose your brand, and they are happy to do it because it makes them look good. An example of this is Mailchimp.
- Collaborative Virality: users who want external parties to view their work can interact with them and invite them, driving user addition and awareness. Some examples of this are Slack and Figma.
Solves a NeedDiscoverable in Context: through documentation or support content, users discover the product trying to find a solution for a need. Some examples are MongoDB and snyk.
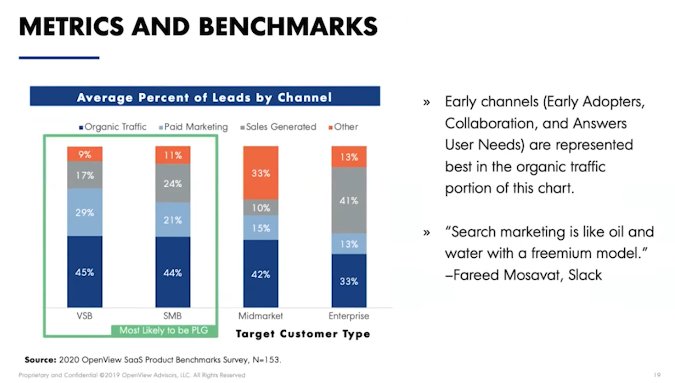
Metrics & Benchmarks
Which audiences are more likely to be product-led?
Currently, organic is dominating the channels. Paid marketing is pretty small and generates low sales.
So how do you get to the next level with organic traffic?
To do that, we pull out some old-school marketing and track your Share of Voice (SOV).
Your SOV focuses on the weight of a topic amongst other advertisers. It’s a measure of the market your brand owns compared to the competition.
For example, if you’re selling tissues like Kleenex, you’re going to look for other keywords used for Kleenex, such as “runny noses.”
And if you want to own them organically, then you want to write content around that.
Here are three ways you can measure the market your brand owns:
- Decide what topics you want to be tracking (10 or fewer).
- Then, use the supplied tracker to monitor your rank on those terms in incognito mode.
- Plan marketing objectives around your SOV.
Stay focused on your content strategy, so you can accurately track how your brand is doing.
Going back to our Kleenex example, you want to track in Incognito mode how you are ranking for facial tissues or how you are ranking in “cold remedies.”
Do this on a month-to-month basis to monitor your content marketing and how it relates to ROI. The results will feed your planning objectives of gaining a share of voice and, in turn, your quarterly planning.
#4: Convert
The easiest part of the framework to understand but the hardest to put into practice is Convert.
Product-led businesses focus on monetizing the value that they provide or, put simply, getting users to subscribe.
It’s essential to ask:
- Are users paying for the tool?
- How are they receiving value before the paywall but ensure they Convert?
It’s a dance between value, pricing, and understanding how you value your product.
Three drivers for converting are:
- Activation
- Packaging
- Pricing
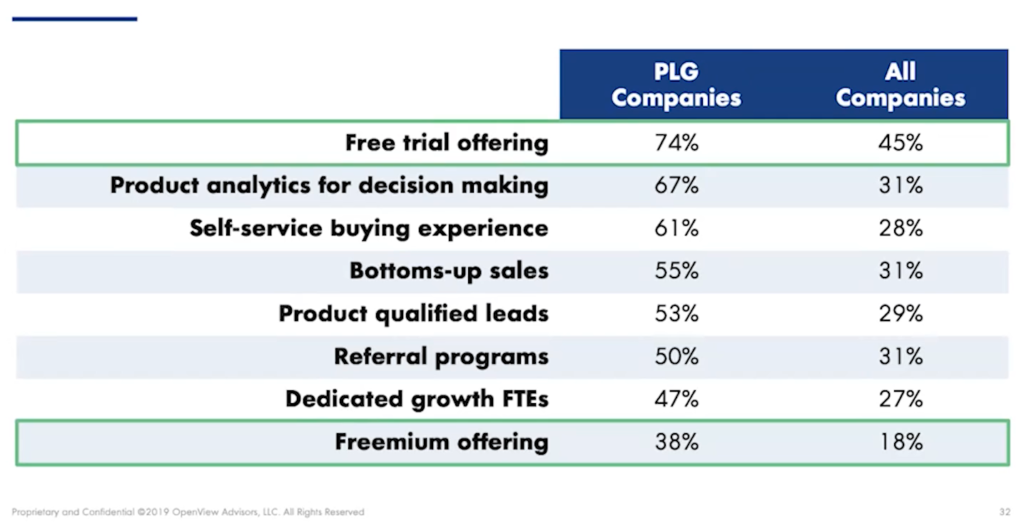
Around 74% of PLG companies are currently offering a freebie, as are 45% of all companies. The free trial is increasingly growing across the board because it works
So how do you create a hook?
Creating a hook can get a user engaged fast and bring them quickly to the value proposition of your product.
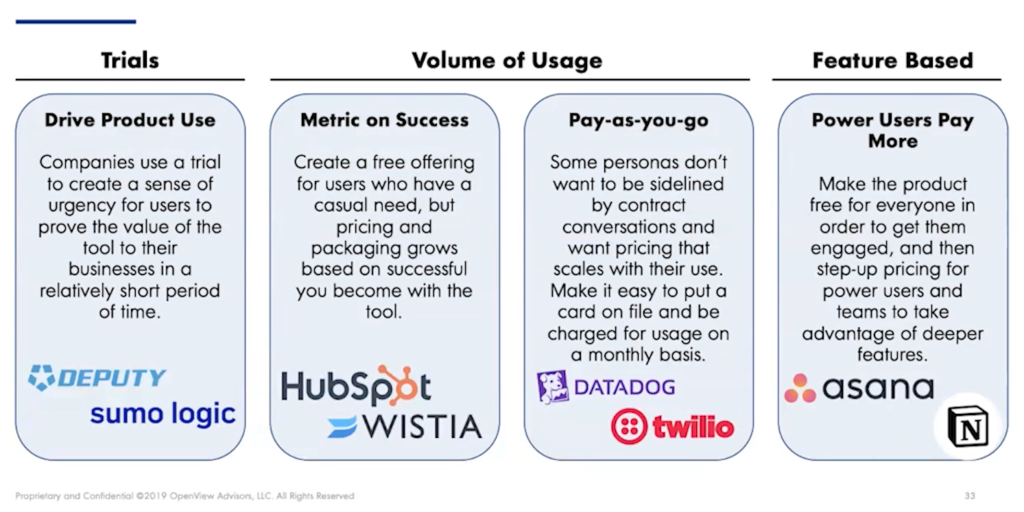
Hooks to use are:
- Trials: drive product use and help create a sense of urgency for users to understand the value of a tool.
- Volume of Usage: create a free offering for users who have a casual need, but pricing and packaging based on success as a user. Or pay-as-you-go for users that don’t want a contract and need pricing that scales with their use. Make it easy to put a card on file and charge for usage every month.
- Feature-Based (aka freemium): make the product accessible for everyone to get them engaged, then price up for power users and teams for deeper features.
Accompany the hook with price, packaging, and Activation to lead the user down the road to Convert.
Warning: Don’t Form Your Sales Team at the Last Minute
Keep in mind that sales still play a crucial role in most self-serve businesses, and 75% of products have some sort of sales touchpoints in them.
Sales still play a significant role in conversion. If you’re still driving the sales as a founder, don’t stress; however, when the time comes, take the time to establish a team. It takes time for everything to click; not all sales members hit the ground running.
Metrics & Benchmarks for Conversions
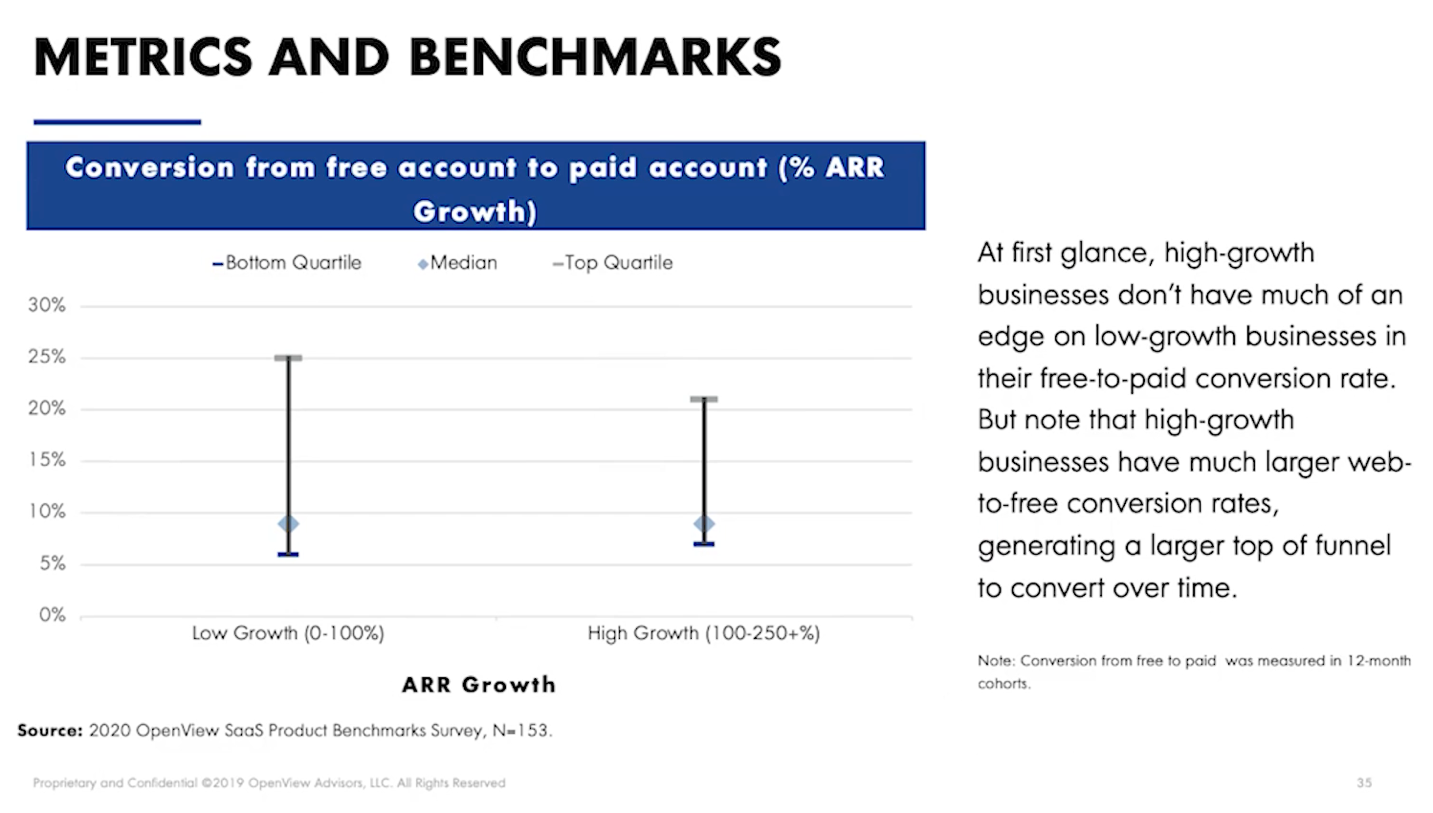
At first glance, high-growth businesses don’t have the edge over low-growth companies on conversion rates from free to paid.
However, it’s important to recognize that high-growth companies typically have more significant web-to-free conversion rates.
That larger top-funnel can Convert more overtime at about 10% on the medium.
#5: Scale
Once a user is paying, your work isn’t done. To Scale, you have to retain all the users you’ve acquired, i.e., that have signed up and paid for your product.
Then you need to expand so that users are interested in paying even more for usage.
And finally, figure out ways to drive virality.
Three priorities to Scale are:
- Expansion
- Retention
- Driving Virality
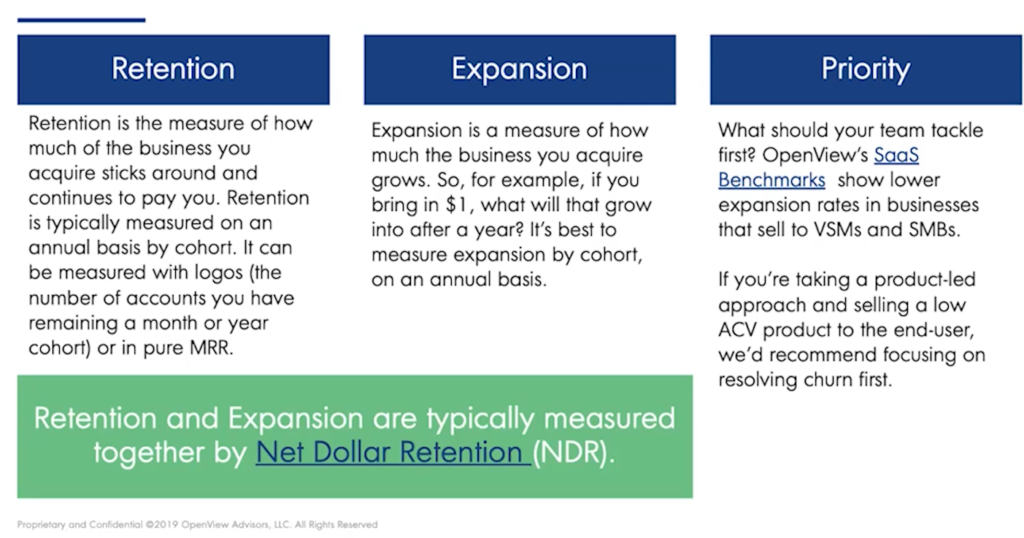
Which of these should your team tackle first?
Companies that take a product-led approach and sell to small businesses have lower expansion rates. So be sure to resolve any issues to help combat churn and focus on retention models to allow expansion.
To drive home the point of how crucial expansion is, let’s look at an example of two companies.
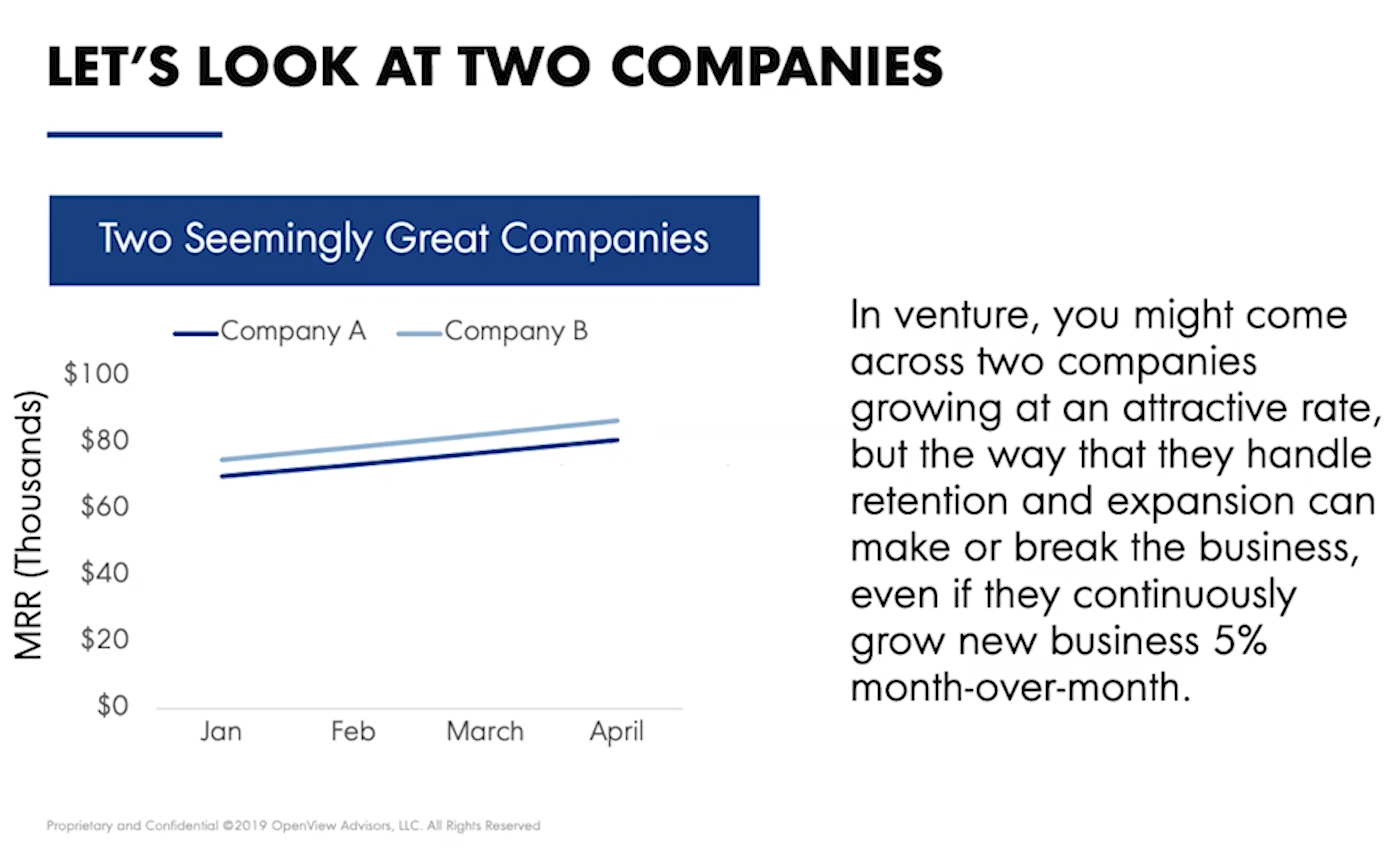
They both can grow at the same rate, but how they handle retention determines its success.
As you can see above, Company B has a higher MRR than Company A through retention.
However, good expansion can turn it around!
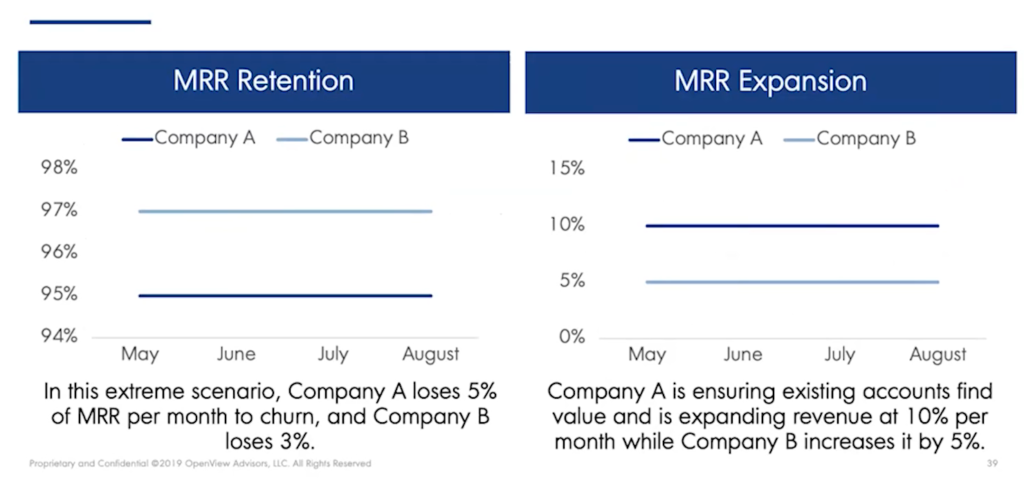
Company A is losing more MRR per month to churn than Company B. Company A is working hard to ensure existing accounts keep finding value and is expanding revenue at 10% per month, while company B is only increasing by 5% per month.
Company A is also bolstering slow sales with expansion, so even though they have higher churn than Company B, they’re coming out ahead in MRR with growth.
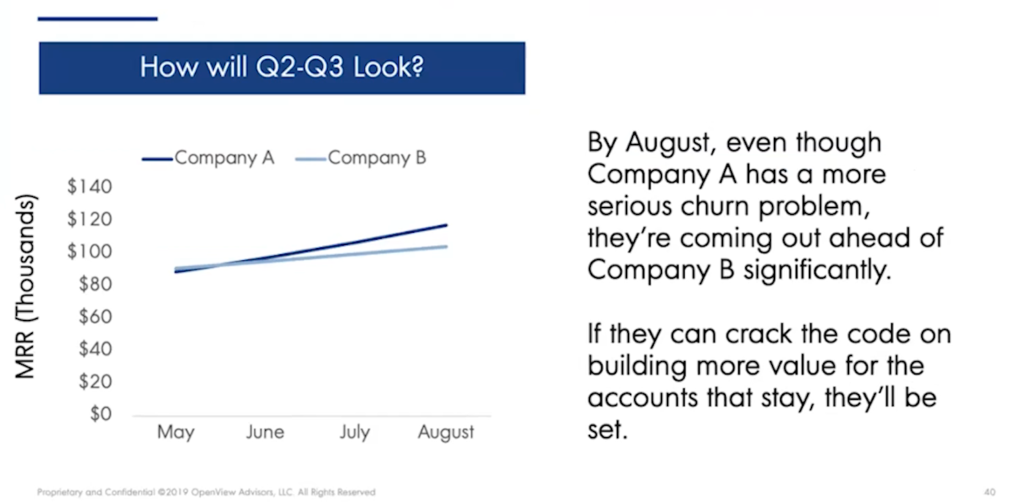
If Company A can crack the code on building more value for the accounts that stay, they’ll be set.
When looking at metrics and benchmarks, retention is vital in building a lasting business.
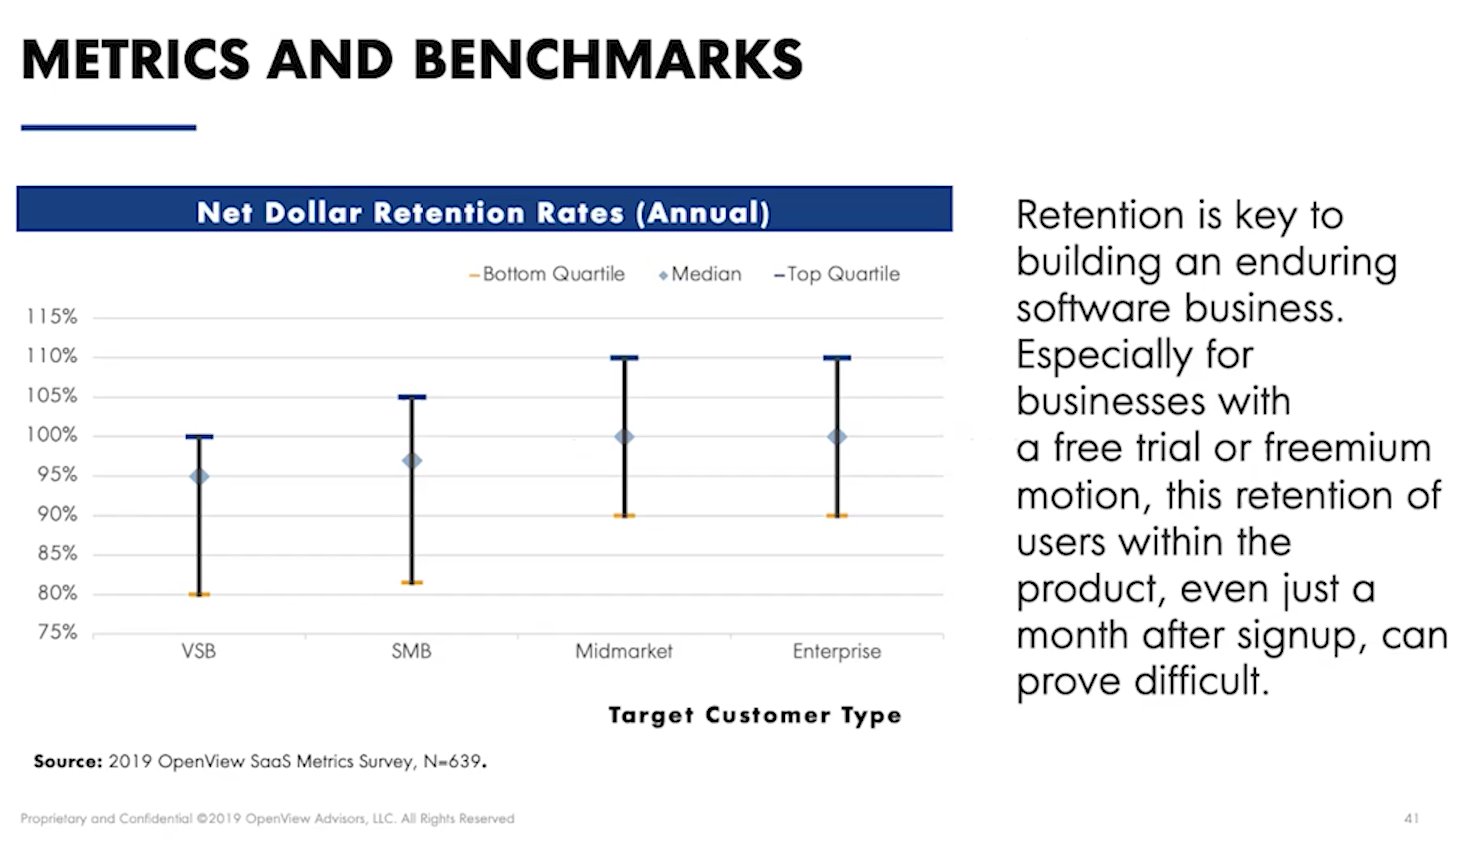
It can be difficult for businesses that offer a free trial or freemium to keep retention up even just a month after signing up.
Play with the boundaries between free and paid, ensuring value, to see where the user draws the line.
This step also reiterates how vital Activation is.
So how do you level up your retention?
Three tactics to consider are:
- Telemetry
- Onboarding
- Community
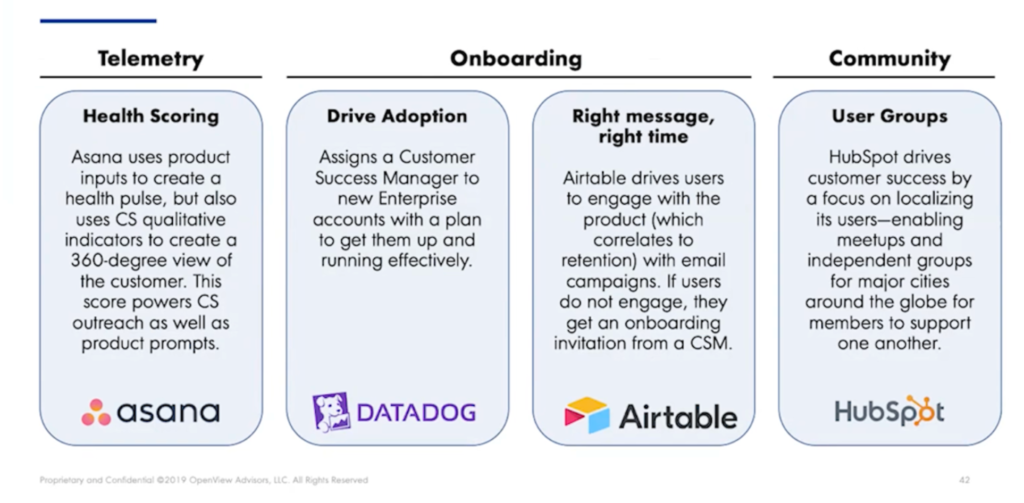
Applying these tactics is unique to each company. However, there are some tremendous present-day examples of how these tactics have driven retention for companies such as HubSpot and Asana.
Can your company use at least one or two of these tactics?
In Conclusion
So, you've gone through the framework, you think you've applied some of the tactics, but you still have questions?
Reach out to folks in the PLG network, join webinars, and continue doing research. Consider all the businesses out there that are product-led and all the amazing practitioners that are ready to advocate for smaller firms. These guys have been where you are now and are happy to help you come out of the “Messy Middle.”