As founders and leaders in the B2B SaaS space, you're constantly bombarded with advice about how to grow your businesses.
Focus on product-led growth.
"Go upmarket."
"Optimize your pricing."
But which of these actually moves the needle? And how do priorities change as your company evolves?
Instead of relying on anecdotes from unicorn outliers or theoretical frameworks, I wanted to share some fascinating insights from a comprehensive study of 446 real B2B SaaS companies.
It's based on the data we've gathered from the companies that have taken the ProductLed Assessment from October 2024 to March 2025.
This research reveals clear patterns that separate high performers from the pack, and the findings might challenge some of your assumptions about what drives growth.
The Self-Serve Revenue Revelation
If there's one insight that jumps out from the data, it's this: developing self-serve revenue capabilities is the single most powerful lever for B2B SaaS performance.
Companies with self-serve revenue consistently outperform their counterparts across virtually every metric.
The most dramatic performance improvements happen during the initial transition from zero to even modest self-serve revenue ($100K-$500K).
Companies making this transition reported:
- 14.5% higher overall performance scores
- 25.8% higher pricing optimization capabilities
- 25.9% better free-to-paid conversion rates
- 18.3% faster time-to-value delivery
- Nearly twice the profitability rate compared to companies with no self-serve revenue (68% vs. 36.4%)
And surprisingly, the benefits extend far beyond revenue metrics to encompass improvements in strategy, user understanding, and team effectiveness.
Why Does Self-Serve Revenue Create Such a Powerful Multiplier Effect?
The research reveals several compounding benefits that explain why self-serve revenue drives such outsized performance improvements:
1. It Forces Product Experience Improvements
When your growth depends on users being able to adopt your product without human assistance, you're forced to improve onboarding, simplify interfaces, and eliminate friction points.
You can't rely on salespeople or customer success teams to paper over the cracks in your product experience.
One particularly telling data point: companies with self-serve revenue scored 18.3% higher on time-to-value delivery than those without.
They simply can't afford to have complicated onboarding flows or confusing first-use experiences.
2. It Generates More (and Better) Customer Data
Self-serve channels provide incredibly rich behavioral data that companies can use to identify friction points, optimize conversion paths, and improve targeting.
Instead of relying on second-hand feedback filtered through sales teams, you get direct visibility into how users actually interact with your product.
The data shows that companies with self-serve revenue scored 19% higher on data capabilities than those without.
3. It Enables Rapid Experimentation
When you're not limited by sales cycle timing or customer success bandwidth, you can test new packaging, pricing models, and features much more quickly.
The research shows that companies with self-serve revenue reported a 19% higher ability to translate execution into growth, largely because they could iterate faster on key business elements.
4. It Dramatically Improves Unit Economics
Reducing the sales touch required for conversion improves contribution margins and enables more efficient scaling.
The data reveals that 68.4% of SaaS companies generate under $100K revenue per employee, but those with established self-serve motions achieve far better efficiency metrics, often exceeding $300K per employee.
5. It Creates a Foundation for Hybrid Models
Companies with established self-serve channels can layer sales-assisted approaches on top for larger customers, creating efficient hybrid motions that capture the benefits of both approaches.
The data shows that as companies scale their self-serve revenue beyond the $1M mark, they increasingly adopt these hybrid approaches while maintaining the efficiency benefits of their self-serve foundation.
The Big Three: What Actually Differentiates Top Performers
Beyond self-serve revenue, our research identified three specific capabilities that most strongly correlate with overall business performance:
1. Free Model Intentionality (0.73 correlation with performance)
How deliberately have you designed your free offering?
Companies with highly intentional free models (scoring 8+ on a 10-point scale) reported 57% better free-to-paid conversion rates than those with unintentional approaches (scoring 3 or below).
What makes a free model "intentional"?
The research identified several key elements:
- Clear alignment between free and paid offerings, where the free tier showcases core value while creating natural upgrade needs.
- Deliberate value limitations that create organic upgrade paths.
- User segmentation to identify and nurture high-potential customers.
- Strategic friction reduction for key activation actions.
- Visible upgrade benefits built directly into the free experience.
The data shows that 35.4% of companies rate their free models as unintentional, representing a massive opportunity for improvement.
And interestingly, free model intentionality scores actually increase as companies scale their self-serve revenue, suggesting that successful companies continuously refine their approach.
2. Time-to-Value Delivery (0.69 correlation with performance)
How quickly can new users experience the core value of your product?
Companies in the top quartile for time-to-value delivery (scoring 7+ on a 10-point scale) reported 38% higher overall performance scores and 62% better conversion rates than those in the bottom quartile.
Despite its importance, 40% of SaaS products rate themselves poorly on delivering value quickly.
Common time-to-value challenges include:
- Front-loading configuration requirements before providing value
- Requiring excessive customer data during signup
- Misunderstanding what constitutes "value" for different user types
- Poor onboarding guidance and education
High-performing companies obsessively measure and optimize time-to-value, treating it as one of their most important product metrics and systematically removing friction from initial experiences.
3. Bottleneck Awareness (0.65 correlation with performance)
Can you consistently identify the #1 constraint limiting your growth?
Companies that excel at pinpointing their primary bottlenecks report 41% faster revenue growth than those that struggle with this capability.
Yet 32.1% of companies acknowledge they cannot consistently identify these bottlenecks, causing them to solve the wrong problems while real limitations persist.
Common manifestations of bottleneck blindness include:
- Simultaneously pursuing too many improvement initiatives.
- Addressing symptoms rather than root causes.
- Misattributing growth limitations.
- Making decisions based on anecdotes rather than data.
- Lacking consistent analytical frameworks for diagnosis.
Companies that excel at bottleneck identification develop systematic approaches for diagnosing constraints, prioritizing actions, and measuring results.
They treat bottleneck identification as a formal process rather than an occasional discussion topic.
The Eight Critical Growth Blockers in B2B SaaS
The research identified nine specific challenges that prevent B2B SaaS companies from reaching their full potential.
These growth blockers represent the highest-leverage opportunities for improvement:
1. The Monetization Blind Spot
55.4% of SaaS companies score themselves below 5/10 on free-to-paid conversion capability (averaging just 4.11/10).
This challenge manifests in several ways:
- Unclear or missing conversion paths within the product
- Failure to identify and target high-intent users
- Overreliance on sales outreach for conversions
- Poor timing of upgrade prompts
- Value misalignment between free and paid offerings
Companies with self-serve revenue score 25.9% higher on free-to-paid conversion capabilities than those without.
They've developed systematic approaches for identifying conversion triggers, optimizing upgrade points, and aligning product value with pricing tiers.
2. The Revenue Efficiency Crisis
68.4% of SaaS companies generate under $100K revenue per employee, while top performers achieve $300K+ per employee.
This operational inefficiency typically stems from:
- Overinvestment in customization for individual customers
- Manual processes that could be automated
- Misalignment of team structure with growth priorities
- Spreading resources too thinly across multiple initiatives
- Failure to optimize customer acquisition costs
The data shows that as companies develop self-serve revenue, their revenue efficiency improves dramatically.
3. The Self-Service Gap
36.3% of B2B SaaS companies report generating zero self-serve revenue, despite its proven impact on performance.
This gap typically results from:
- Unnecessary complexity in product experiences
- Overreliance on sales-led motions
- Lack of clear expansion pathways within the product
- Missing or ineffective product analytics
- Resistance to changing established sales processes
Interestingly, the research shows that companies with zero self-serve revenue actually have decent user understanding (62.9%) and team capabilities (56.9%).
They have the foundational knowledge and skills, but haven't translated these into effective self-serve experiences.
4. The Strategic Pricing Vacuum
Pricing received the lowest self-assessed component score (40.5%) across all business dimensions measured in the research.
Common pricing challenges include:
- Failing to align pricing with customer-perceived value
- Using cost-plus or competitor-based pricing approaches
- Overly complex pricing structures
- Inconsistent discounting practices
- Poor packaging of features across tiers
The data shows that companies with self-serve revenue score 25.8% higher on pricing optimization than those without.
They've developed approaches for testing price sensitivity, measuring value perception, and aligning their pricing structure with natural customer segments.
5. The Time-to-Value Delay
40.0% of SaaS products rate themselves poorly on delivering value quickly, despite this being one of the strongest predictors of overall performance.
This challenge typically stems from:
- Front-loading configuration requirements
- Requiring too much customer data before providing value
- Failing to identify and optimize critical first experiences
- Misunderstanding what constitutes "value" for different users
- Poor onboarding guidance and education
The research reveals that time-to-value delivery improves significantly as companies develop self-serve revenue, with self-serve companies scoring 18.3% higher on this dimension.
6. The Differentiation Deficit
40.2% of companies struggle to position themselves as the obvious choice in their market.
This challenge manifests as:
- Generic messaging that could apply to any competitor
- Feature-focused rather than outcome-focused positioning
- Failure to articulate unique capabilities or approaches
- Inconsistent positioning across customer touch points
- Poor alignment between marketing claims and product reality
Interestingly, market differentiation scores improve by 15.9% as companies develop self-serve revenue, suggesting that the process of creating self-serve paths helps clarify and strengthen positioning.
7. The Activity-Results Disconnect
41.0% of companies believe they cannot effectively translate business execution into growth.
This disconnect typically stems from:
- Focusing on output metrics rather than outcome metrics
- Poor alignment between activities and strategic priorities
- Launching features without clear success criteria
- Failing to connect team activities to business results
- Rewarding effort rather than impact
Companies with self-serve revenue score 19% higher on execution-to-growth translation, suggesting that self-serve motions create clearer connections between activities and results.
8. Bottleneck Blindness
32.1% of companies report they cannot consistently identify their #1 growth constraint, despite this capability showing a strong correlation with performance.
This blindness manifests as:
- Simultaneously pursuing too many initiatives
- Solving symptoms rather than root causes
- Misattributing growth limitations
- Making decisions based on anecdotes rather than data
- Failing to develop consistent analytical frameworks
The data suggests that bottleneck awareness improves as companies develop more systematic approaches to growth, with execution-to-growth translation scores increasing by 19% as companies develop self-serve revenue.
Different Stages, Different Challenges: How Priorities Evolve
One of the most valuable aspects of this research is how it reveals distinct performance patterns at different growth stages.
The data shows that companies face an evolution of challenges as they scale, and the most successful companies adapt their focus accordingly.
Pre-Self-Serve Revenue Stage
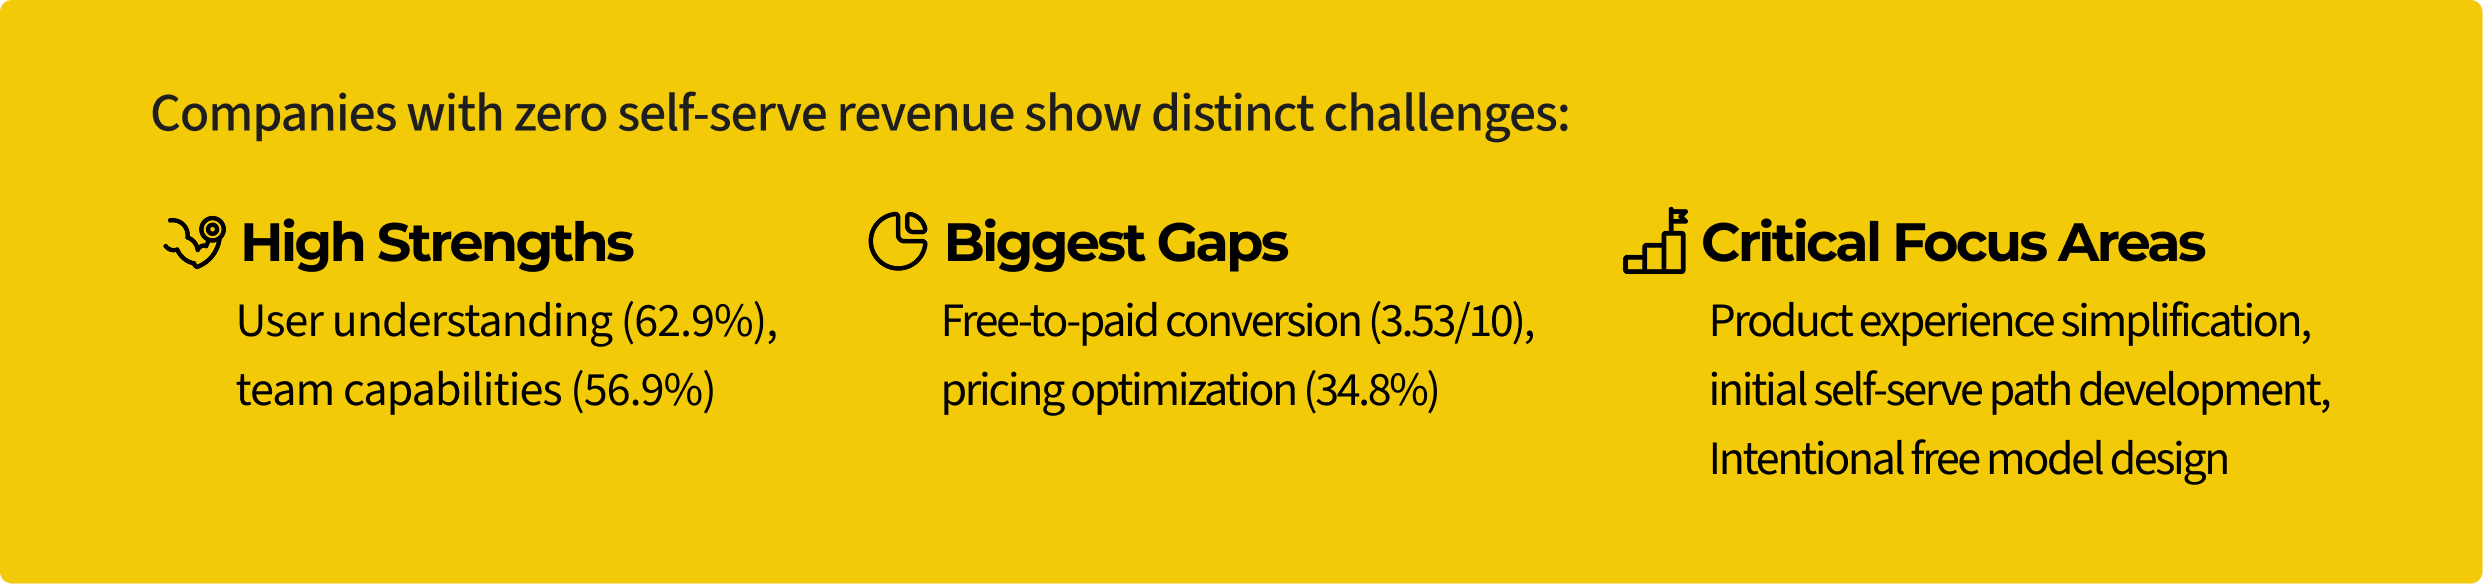
At this stage, companies typically have decent understanding of their users but struggle to translate this understanding into effective product experiences that can drive self-serve conversion. Their teams often have the necessary capabilities but lack the processes and tools to execute effectively.
Key performance indicators to focus on include time-to-first-value, user activation rate, product satisfaction metrics, and sales-assisted conversion rate.
Early Self-Serve Revenue Stage ($100K-$500K)
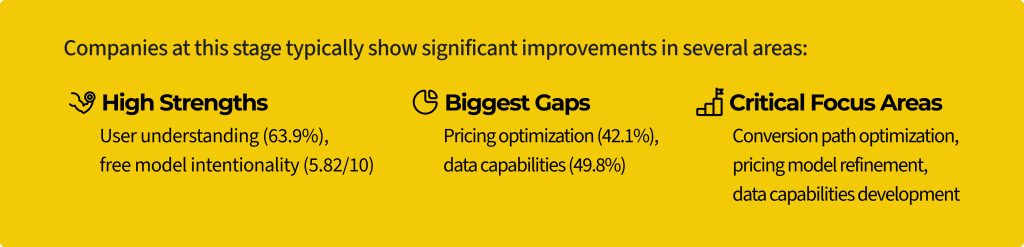
These companies have established initial self-serve paths but often struggle to optimize pricing and leverage data effectively. They typically see improved profitability (56.8% are profitable compared to 36.4% at the previous stage) but face new challenges in scaling their self-serve approaches.
Key performance indicators shift to self-serve conversion rate, free-to-paid upgrade rate, revenue per visitor/user, and customer acquisition cost.
Scaling Self-Serve Stage ($500K-$4M)
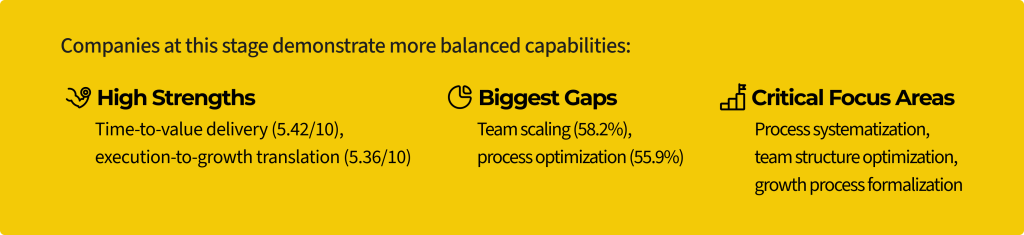
These companies have established effective self-serve motions but face challenges in systematizing processes and scaling their teams efficiently. They typically see improved unit economics (65.3-71.9% are profitable) but struggle with organizational scaling.
Key performance indicators evolve to revenue per employee, customer lifetime value, expansion revenue percentage, and growth rate sustainability.
Advanced Self-Serve Stage ($4M+)
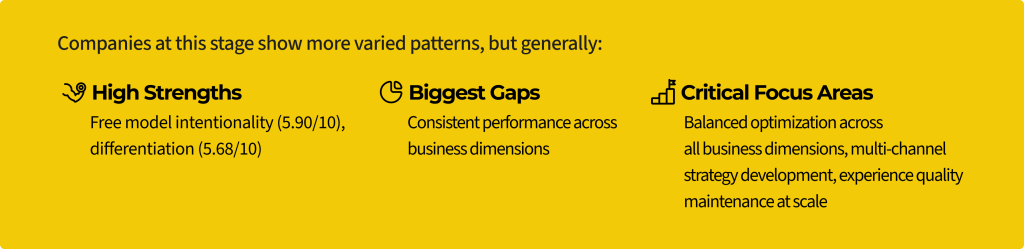
These companies have typically developed relatively balanced capabilities across most dimensions, with few obvious weaknesses. Their primary challenge becomes maintaining consistent performance as they continue to scale, particularly in maintaining product quality and customer experience.
Key performance indicators shift to net revenue retention, market share growth, customer satisfaction metrics, and employee productivity metrics.
Practical Recommendations for Your Growth Stage
Based on this research, here are specific recommendations tailored to different growth stages:
For Companies with Zero Self-Serve Revenue
1. Create Your First Self-Serve Path
The data is clear: even modest self-serve revenue correlates with significant performance improvements. Start small:
- Identify your simplest use case with the clearest value proposition
- Design a streamlined onboarding experience focused on fast time-to-value
- Implement frictionless payment options with appropriate starter pricing
- Start with a limited scope rather than trying to enable all features
Remember that 36.3% of B2B SaaS companies report zero self-serve revenue, so even modest progress here can create competitive advantage.
2. Develop an Intentional Free Model
Free model intentionality shows the strongest correlation with overall performance (0.73), yet 35.4% of companies rate their free models as unintentional:
- Design your free tier to showcase core value while creating natural upgrade needs
- Implement clear upgrade triggers based on usage patterns or value milestones
- Build visibility into upgrade benefits directly within the free experience
- Focus on activation metrics before focusing on conversion metrics
3. Optimize Time-to-Value
The research shows time-to-value delivery has a 0.69 correlation with overall performance, yet 40% of products rate themselves poorly on this dimension:
- Map and measure your current time-to-first-value
- Eliminate or defer unnecessary setup and configuration steps
- Provide pre-populated examples and templates where possible
- Develop guided onboarding experiences for key user types
For Companies with Early Self-Serve Revenue ($100K-$500K)
1. Optimize Your Pricing Model
Pricing received the lowest self-assessed component score (40.5%) across all business dimensions, and companies at this stage still struggle with pricing optimization (42.1%):
- Test different pricing structures to identify optimal price points
- Develop tiered offerings aligned with distinct customer segments
- Implement customer-friendly trials and expansion paths
- Create clear differentiation between tier capabilities
2. Build Data Capabilities
Data capabilities represent a significant gap (49.8%) for companies at this stage:
- Implement event tracking across the entire user journey
- Develop dashboards for key conversion and engagement metrics
- Start building predictive models for conversion likelihood
- Establish experimentation capabilities for continuous optimization
3. Systematize Conversion Paths
Free-to-paid conversion improves at this stage (4.53/10) but still has significant room for growth:
- Implement behavior-based upgrade triggers
- Develop personalized conversion messaging based on usage patterns
- Create seamless upgrade experiences without registration barriers
- Establish regular testing cadence for conversion elements
For Companies with Scaling Self-Serve Revenue ($500K-$4M)
1. Systematize Growth Processes
Execution-to-growth translation becomes a strength at this stage (5.36/10), but process optimization remains a gap (55.9%):
- Develop formalized frameworks for identifying growth bottlenecks
- Establish cross-functional growth teams with clear metrics
- Implement regular review processes for key performance indicators
- Create playbooks for repeatable growth activities
2. Optimize Team Structure
Team scaling emerges as a significant gap (58.2%) at this stage:
- Align team organization with customer journey phases
- Develop clear ownership boundaries for cross-functional responsibilities
- Implement metrics cascades that connect individual work to business outcomes
- Create specialized roles focused on optimization rather than just feature delivery
3. Balance Acquisition and Expansion
At this stage, expansion revenue becomes increasingly important:
- Develop distinct strategies for net-new acquisition vs. expansion revenue
- Implement account expansion triggers based on usage patterns
- Create seamless cross-sell and upsell paths within the product
- Optimize unit economics separately for acquisition and expansion motions
For Companies with Advanced Self-Serve Revenue ($4M+)
1. Maintain Experience Quality at Scale
As you scale, maintaining consistent experience quality becomes challenging:
- Implement robust quality metrics across the customer journey
- Develop proactive monitoring for experience degradation
- Create specialized teams focused on experience optimization
- Build customer feedback loops into all product development processes
2. Develop Multi-Channel Strategy
At this stage, balancing self-serve and sales-assisted approaches becomes crucial:
- Create seamless handoffs between self-serve and sales-assisted motions
- Develop complementary pricing and packaging for different channels
- Implement account scoring to route prospects to appropriate channels
- Build unified analytics across all customer acquisition channels
3. Optimize for Retention and Expansion
The research shows that net revenue retention becomes increasingly important at this stage:
- Develop sophisticated health scoring models
- Implement predictive churn identification
- Create personalized expansion recommendations based on usage patterns
- Build automated expansion paths for common growth scenarios
The Bottom Line: What This Means for Your Business
The most striking conclusion from this research is that developing self-serve revenue capabilities represents the single most important transition for B2B SaaS companies.
The data shows that even modest progress in this direction correlates with significant improvements across all business dimensions.
The most dramatic performance improvements occur during the initial transition from zero to $500K in self-serve revenue. Companies making this transition see a 14.5% improvement in overall performance scores and are nearly twice as likely to be profitable.
This transition typically requires several fundamental changes:
- Streamlining the onboarding experience
- Creating deliberate conversion paths in the product
- Developing frictionless payment processes
- Building internal analytics capabilities
- Establishing self-serve customer support systems
For most companies, these improvements require significant cross-functional effort but yield compounding benefits far beyond the initial self-serve revenue. The question isn't whether to develop self-serve capabilities, but how quickly you can begin the transformation.
The research also highlights the importance of adapting your focus as you grow.
The challenges you'll face at $500K in self-serve revenue are different from those at zero, and the metrics that matter will evolve accordingly. By understanding these patterns, you can make informed decisions about where to focus your resources for maximum impact.
What's particularly encouraging about this research is that it reveals clear, actionable paths to improvement.
These aren't theoretical frameworks or unicorn strategies. They're practical approaches validated across hundreds of real B2B SaaS companies at different growth stages.
The gap between average and high performers isn't magical or mysterious. It's systematic and addressable.
By focusing on the right capabilities at the right time, you can navigate the journey from zero to significant self-serve revenue and unlock the performance improvements that come with it.
This analysis is based on comprehensive assessment data collected from 446 validated B2B SaaS companies between October 2024 and March 2025.