SaaS businesses often work with large amounts of data to make critical decisions. However, they need the proper metrics in place to benefit from the data. But product-led companies often need help determining which SaaS metrics to focus on.
This guide encompasses everything you need to know about your benchmark SaaS metrics. Discover an overview of financial to lifecycle metrics, trial models, freemium models, and more. You’ll understand why these metrics are important, how to track them, and learn how to use them in your product-led strategy.
A crucial step in your product-led strategy is the conversion of trial or freemium users to paying customers. And with this, you need to know how to qualify those leads and ensure the right product fit.
This article is packed with essential tips and strategies – settle in with your beverage of choice and discover how to leverage your key SaaS metrics.
https://www.youtube.com/watch?v=ZoS_pT3WWkI
Why and How Product-Led Companies Should Track Key Metrics
For product-led companies, the product is the focal point for acquiring and retaining customers. The metrics used by each company relate directly to the product and indicate whether users receive value.
This differs from other types of companies, where they might track cart abandons, product reviews, and sales.
The SaaS industry has become increasingly competitive, with an expectation for the market to reach 208 billion U.S. dollars by 2023. This calls for an emphasis on growth in SaaS. Product-led SaaS companies need to track and use data proactively to stay relevant in a booming market.
Prepare for a deep dive into five key metrics for your product-led strategy. Why only five? It’s easy to get lost in a sea of data. And ultimately, it isn’t useful to track everything without knowing what actions to take.
Discover the key SaaS and growth metrics that you should measure for a product-led strategy.
Key SaaS Metrics to Track When Building Your Product-Led Strategy
SaaS companies looking to build a product-led growth strategy typically track five product usage metrics when evaluating their growth and conversion strategies.
- Active Users (DAU/MAU)
- Retention rate
- Engagement score
- Adoption score
- Time to Value
It’s best to approach product usage metrics with user segmentation to fully understand your different personas. As well, you should monitor the metrics at a contact and company level.
1. Active Users
Active users are the total number of unique users that engage with a SaaS product. SaaS platforms use these KPIs to get a clear idea about the unique individuals that use the platform in specific periods. This is important to understand growth, gauge customer engagement, and see patterns in user behavior.
Measure your active users based on the time period:
- Daily active users (DAU)
- Weekly active users (WAU)
- Monthly active users (MAU)
The easiest way to measure is by using the session time. For instance, the session starts every time a user connects to the site or performs an action, and ends when they leave that particular page or finish the action.
So, the action performed gets recorded to track the exact session time. Then, using the session time, calculate the DAU, WAU, or MAU.
2. Retention Rate
Retention rate indicates how long a user stays on your platform and whether they are using it.
Calculating retention rate is relevant when any organization offers a freemium platform or paying customers. Teams will understand which features grab clients' attention or convert them to paid.
Industry-wide, a good SaaS churn rate benchmark falls between 5% to 7% for annual churn and under 1% for monthly churn.
3. Engagement Score
A customer engagement score is a single number that shows the extent to which the customers engage with the platform.
The engagement score looks at how often and deeply users engage with features or perform tasks in a SaaS product. A platform that encourages users to take action and perform multiple tasks is more engaging.
The engagement score is measured by taking stock of the key actions of the users on a daily, weekly, or monthly basis. Take the calculation of engagement from trends in these scores over time.
4. Adoption Score
The adoption score looks at how deep users go into the features. The adoption rate or the adoption score measures the number of customers using a specific feature type.
For example, if they’re using a to-do list feature on a platform, you can measure how many tasks they’re creating or whether they’re sharing with others.
5. Time-to-Value
Time-to-value is a metric that measures the amount of time new customers take to get value from a product. This metric aims to reach the “Aha moment” when a new product or feature is launched.
Teams can define points or break points in the product that indicates a user’s deeper understanding.
In summary, it’s a SaaS metric that measures:
- How long a user takes to adapt to new features of the product
- If the user understands the new updates
- If the user gets a unique value
How to Track Usage Metrics
Tracking usage metrics aims to understand how users engage with a certain product, and it also shows the difficulties they might face.
If users engage with the product for more extended periods, then your team will be able to understand why. And then take action to improve continually.
Here are two ways to track product usage metrics:
Tracking at the Contact and Company Level
You need to track the metrics at the company level to determine the number of SaaS platform users. SaaS organizations track a particular user and watch groups of users who are part of one account or company.
Based on the metrics, your team can get a number of daily active accounts on its platform, not just individual contacts. This approach helps filter the key accounts and improve metrics for groups of contacts.
Segmenting Your Users
You can segment your user base into different fields, such as region or country. Users can also be segmented based on how they use the product and features on the SaaS platform.
With segmentation, you can:
- Personalize user onboarding
- Narrow and tailor your marketing efforts
- Test hypotheses
- Delight users and boost loyalty
And much, much more. Selecting and segmenting your customers is crucial, no matter which way you do it.
Financial Metrics
Financial metrics are used for measuring the financial performance of a business and should include:
- Conversion rate
- Revenue
- MRR/ARR
- Net MRR
- ARPA/ ARPU
- LTV
- Churn Rate
You need to know whether your growth efforts are financially impacting your business. Start with these six financial metrics:
1. Conversion Rate
The conversion rate can determine the number of website visitors converted into customers or from trial users to engaged, paying customers. The conversion rate will look at the number of signups, or freemium users, to paying users.
How to measure this metric:
Calculate the conversion rate by dividing the number of users who converted to paid by the number of total users who signed up for the freemium or trial.
2. MRR/ARR
Monthly recurring revenue (MRR), is a metric that measures the amount of income the business venture generates every month. The annual recurring revenue (ARR), is the metric that measures the monetary profit that is generated yearly.
For most organizations, MRR means recurring charges like coupons, discounts, and other add-ons. At the same time, ARR denotes a yearly subscription to any service.
It is important to calculate ARR/MRR to get a clear idea of the revenue generated by the organizations by giving discounts or by offering different types of subscriptions.
How to measure the metric(s):
- MRR is calculated as the total number of active customers multiplied by the average revenue per user.
- ARR is calculated as the overall subscription cost per year plus recurring charges.
3. Net MRR
Net MRR is the net increase or decrease in the MRR from one month to the next. This metric is important for tracking the variations in revenue between months.
How to measure the metric:
Net MRR is calculated as Existing MRR + New Business + Reactivation Charges + Expansion MRR - Churn
4. ARPA/ARPU
Average revenue per month (ARPA) is a SaaS metric that calculates the revenue generated from one user account every month. It helps compare groups of accounts and exposes account contractions and expansion trends.
Average revenue per user (ARPU) is a SaaS metric to calculate the total value of the users or groups of users that the organization is segmenting.
How to measure the metric:
ARPA is calculated as the tTotal monthly recurring revenue / Total number of accounts
APRU is calculated as - MRR / Total number of active users
5. CAC/LTV
Customer acquisition cost (CAC) is a financial metric that helps in measuring how much a company spends to get new customers. Knowing the total amount spent by the Sales and Marketing team is essential.
How to measure the metric:
- CAC is calculated as Total Cost of Expenses / Acquired Customers
Lifetime value (LTV) is the calculation of the average amount spent by the user for acquiring your business services and the total number of churns. This metric shows organizations the actual value of a user over their customer lifespan.
How to measure the metric:
- LTV is calculated as Average revenue per user * 1/Churn
6. Churn Rate
The churn rate shows how many users dropped off of a SaaS platform over a given time frame. Knowing the churn rate as it shows where there could be issues in your product, marketing, onboarding, or other essential pieces in the revenue puzzle.
How to measure the metric:
Churn Rate is calculated as lost customers / total customers at the beginning * 100
Lifecycle Metrics
Lifecycle metrics calculate the user life cycle over a period of time through the different stages:
- Onboarding
- Adoption
- Expansion
- Renewals
- Churn
It’s impossible to have the same measures for every lifecycle stage. For example, the calculation for freemium, trial users, and paying customers isn’t the same in the adoption phase. This is because the objectives are completely different.
Let’s explore how to adapt to these three types of lifecycle metrics.
1. Health
Customer health metrics are calculated at every life cycle to measure the user’s health. Health can be a specific score or a combination of metrics, like engagement rate, adoption, and more.
The health metric is calculated to understand the business, troubleshoot issues, monitor growth, and drive action.
Customer health metric is calculated as Total Action of Value 1 + Total Action of Value 2 + ... + Total Action of Value N.
2. Pulse
The pulse metric is known as the human touch, enabling SaaS companies to learn about their users with the help of a Customer Success team. This metric is separate from the numerical data you’d get from your dashboard.
The human part is vital to complement the algorithm – it can add a deeper layer to the outcomes of the users through an authentic human exchange. Customer Success supports this more profound understanding of your users.
3. Satisfaction
The customer satisfaction metric assesses the satisfaction level of a SaaS platform’s users. This helps organizations know if their products and features are actually providing value to users, and hopefully delighting them, too.
Customer satisfaction score is typically calculated through a survey, where you will get an net promoter score (NPS) rating to gauge customers’ perception of your company.
Key Metrics for Different SaaS Subscriptions
Subscription (Trials)
A trial-based subscription allows users to try out a SaaS product and find value. It’s important to know how efficient your trial model is.
Some of the metrics to measure in the trial model are:
- New trials
- Engagement
- Adoption
- Conversions
- Revenue converted
- Spend efficiency CAC/LTV
New trials should increase efficiency, SaaS companies can improve them to get better engagement and adoption rates, increasing user conversions.
Subscription (Freemium)
In the freemium model, users can use the product for free, but some features hide behind a paywall.
Metrics to track are:
- New signups
- Retention (Week cohort retention)
- Conversions (% conversion after 1 to 3 months)
- Revenue (MRR)
- Engagement (Key actions per day/week/month)
Freemium subscription metrics calculate essential metrics that indicate if users are moving toward the paid model. The most important is engagement.
Looking at the total percentage of conversions after one to three months of users on the freemium model is wise. After three months, the likelihood of conversion plummets.
Two Ways to Calculate SaaS Metrics
1. Rule/Score-Based
Rule or score-based SaaS metric is an empirical metric calculated using weights and conditions. It’s an empirical method that works well to provide a defined end score.
If you know the parameters, events, features, and attributes of your business, calculating the product’s success is easier.
2. Predictive Engine
A predictive engine uses an algorithm to measure the behavior or processes of users, make sense of them, then predict future outcomes.
To calculate this metric, you need a lot of historical data from the organization. It can become complex if you haven’t tracked data over long periods, or have a newer business.
Be cautious with this metric, as the promises of prediction can come with confusion, even though a predictive engine can help move products and businesses forward.
How to Convert Trial Users to Customers
Converting trial users into customers is a SaaS company’s ultimate goal. OpenView noted that the SaaS industry conversion benchmark from free trial subscribers to customers is 17%.
The best way to hit and exceed these conversion benchmarks is to look at how you provide your customers with their desired outcomes.
It's not just about the product; it's also about the promises that SaaS companies make on their website. A website that describes your product and how well it works should deliver in real life.
How to Qualify Customers Based on Customer and Product Fit
You can determine if you have a good customer fit based on these three categories: Firmography, Geography, and Demography. All three help identify potential customers that will be more likely to adopt your product.
1. Firmography
Firmography reveals business insights into marketing, helps to understand trends, save money and time when getting better leads, and engaging the right users. SaaS companies can collect descriptive attributes to segment target markets and identify their ideal users.
If you have a B2B product, the data samples you could collect include the following:
- Industry type
- Size of the SaaS company
- Number of employees
For example, if you’re targeting small and midsize businesses and you get a contact who works with Coca-Cola, the large corporation wouldn’t be your ideal prospect. Following up with the lead despite not having proper resources and scope would be a waste of time.
2. Geography
The geography metric identifies customers from different locations and segments them based on the city or country they live in. It's critical to define the boundaries of your audience or your ideal persona.
3. Demography
Whether your business is B2B or B2C, you can segment leads based on age, gender, and job profile. Doing so makes it easier to analyze each lead to see if they can qualify as potential customers.
Collect information on your leads from LinkedIn or other social websites to understand if they’re a good fit.
For example, if you have a collaborative application like Notion, you want to target VPs or CTOs. You’ll need to find personal information that relates to their work, so a place like LinkedIn would be a great resource for this type of research.
(Qualifying Customers): Product Adoption
Product fit needs to occur before users can adopt your product. This process happens when leads become aware of the product, understand it, and then start to use it. At this point, they become product-qualified leads (PQLs).
Here are three key ways to qualify customers.
Based on User Behavior
Time to first key action is important to understand because it indicates how quickly users can adopt your product. The time to the second key action typically measures the time to your user’s “Aha! moment.”
“Aha! Moment”
The “Aha! moment” is the stage where the user understands your product’s value.
Correlated to Education
Product adoption correlates to education, which can take many forms. SaaS products can implement a guided tour that quickly moves users to gain value.
You can follow up with educational emails or, for a higher touch option, even a demo that gives segments or specific personas direct access to staff during onboarding. This high-touch interaction can help with more complex products or types of accounts.
How Big SaaS Companies Defined Their PQLs (Examples)
Product-qualified leads (PQLs) are prospective customers who would get value from the product because it meets their needs and solves their problems.
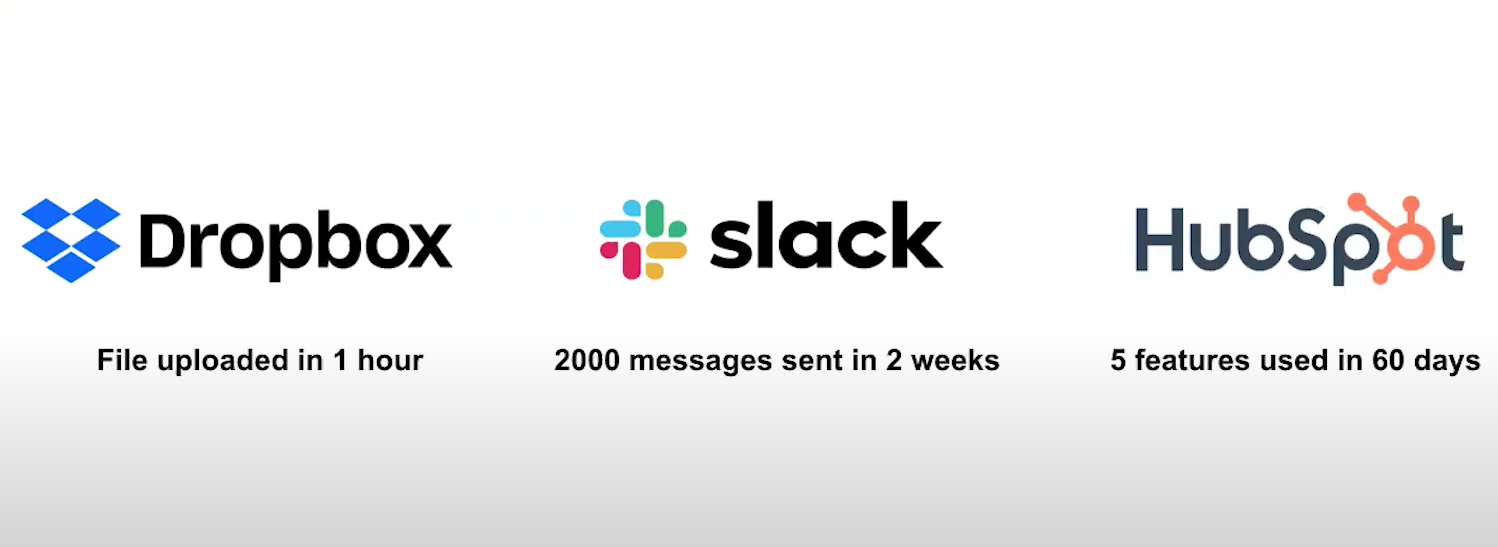
Here are the ways three major players in SaaS define the PQLs.
Dropbox
Dropbox offers free storage space to users with a 2GB storage limit. But users can potentially load thousands of files in an hour.
They use this metric to determine PQLs. They ask how many files have been loaded in an hour and then can determine if the user is qualified.
Slack
Slack enables organizations to connect and communicate within teams. If, when using Slack, trial users send around 2000 messages to groups or individuals, they would consider it a great fit.
Hubspot
Hubspot has five key features that users adopt if they are product-qualified leads. They measure PQLs based on whether the user engages with those features.
Understanding the Product-Qualified Leads Metrics to Boost Your SaaS
Measure and put your efforts towards PQLs by focusing on qualified leads and nurturing low adoption and high fit. When narrowing the focus on the most essential PQLs, you can eradicate the confusion between Marketing, Sales, and Product teams. Align around the metrics that show up through the product.
1. Focus on Qualified Leads
Qualifying leads happens at the intersection between customer fit and product adoption.
If a customer has high adoption and a high customer fit, you know they’re qualified, and you can focus attention on those leads. Your Sales or Onboarding team can then convert them into paying customers at a higher rate.
2. Nurture Low Adoption and High Fit
For the users that are a good fit but with a low adoption rate, automation must be triggered to help the users move to product adoption. You can approach this with high-touch and low-touch strategies.
High-Touch
High-touch is handled by the customer-facing team – usually the onboarding team. It could also trigger the creation of some customer success playbooks that could help facilitate engagement.
This approach is ideal when a SaaS company has different types of users, and they need to engage directly with them. This could look like client demos, emails, or interacting through a chat like Intercom.
Low touch
With low touch, the audience is often broader. Product-led companies can use email communications, guided tours, and automated workflows to help users during integration. Trigger any application to help customers use the product.
Tips and Best Practices for Measuring and Tracking Key SaaS Metrics
1. Find something useful for customers
When any product-led company offers a freemium version, there might be chances that users face an issue with its features or they don’t get what they need.
In the case of Salesmachine, we made the freemium model too wide, jeopardizing our ability to drive sales. Users also found that the time limit was too short during the freemium, so they often asked to extend the trial.
The best solution is to first evaluate the user’s needs and offer features to meet them – this is a user-centric product. We also learned it’s helpful to offer more trial time to the users to understand the product.
A way to do this is to integrate a useful tool like Intercom or Segment that will collect your data in one place.
The main takeaway from this experience is to remove the barriers to collecting and understanding your user’s experiences with a free trial.
2. Keep your metrics simple
At Salesmachine, customers come to us to ask help setting up their applications or when they want to build very complex metrics. Keep your SaaS metrics simple by doing this:
- Prioritize your key metrics
- Start small and measure one after the other
- Check them every quarter before deciding to rework or pivot
Focus more on refining and improving your key metrics, more than anything else. If you look at your dashboard at a glance, you should be able to see if your business is in good health or not and the evolution taking place.
How are you finding your key SaaS metrics?
Product-led SaaS companies need to measure and make use of the metrics that matter most. It can boost smarter business decisions, enhance product engagement, and lead to greater monetization.
Conversion rates will go up when you:
- Use key SaaS metrics to understand the customer conversion rate, satisfaction level, and preferred features
- Optimize the trial user’s onboarding journey to boost user retention
- Offer checklists to the users and motivate them to stick around
- Track product usage for each user
Joining the Product-Led Accelerator Course will only help cultivate knowledge for better customer acquisition, expansion, and retention.
Students for this course will be able to learn directly from world-class PLG experts, do real-world weekly projects, and receive live feedback from experts. There are also year-round workshops that corporate teams and professionals can attend.