
In product-led companies, your dashboard is more than a UI - it's a conversion lever. It's where users first see the value of your product. If your dashboard is confusing or data-heavy, users won’t activate. In this guide, we’ll walk through how to build dashboards that highlight value, drive action, and increase retention.
Dashboard design isn't just about looks; it's about driving user engagement, simplicity, and the perceived value of your SaaS product.
In this article, you’ll learn what functions go into developing a value-based metrics dashboard and how design elements impact platforms in a big way. This exploration isn't just about visuals. It's a practical guide to building trust, streamlining user onboarding, and ensuring lasting user satisfaction.
What Makes a Dashboard Value-Based?
A value-based dashboard helps users instantly understand the progress they've made or the impact your product delivers. Instead of raw data, it surfaces insights. For example:
- “You’ve saved 4 hours this week using [Tool]”
- “You’ve reached 75% of your monthly goal”
- “3 new leads were captured from your last campaign”
The purpose and functionality of your SaaS company dashboard
A SaaS dashboard is a user interface that visually represents data and information related to your SaaS product. It is typically the first screen users see when they log into the platform, giving them a clear overview of their key metrics and tasks.
The purpose of dashboards is to give users a centralized and visualized view of important information and metrics related to their desired outcomes.
Here's a dashboard example that breaks down the daily stats for Geckoboard users.

Dashboards like this help users track their progress, make data-driven decisions, and achieve their goals more effectively.
Just as product features change, so do the needs of its market segments. Startups and seasoned companies should continue rethinking the utility of their dashboard to stay competitive.
Why building a value-based dashboard is essential
A value-based dashboard is designed to provide users with important information and insights that help them achieve their goals and desired outcomes. The design goes beyond displaying data and metrics and focuses on delivering meaningful and actionable insights that drive user engagement, retention, and satisfaction.
Developing a value-based dashboard shouldn’t be overlooked in the early stage of software product development.
A value-based dashboard aims to provide users with the information they need to make informed decisions and take actions that lead to positive outcomes.
Benefits of a value-based dashboard
Benefits of a performance-driven dashboard design include:
- Better UX with the software helps prospects realize your product’s value, improving onboarding critical business perspectives.
- Increases retention and utilization.
- Happier customers boost positive word-of-mouth marketing.
- Satisfying users who perform repetitive tasks helps build frequent users of your software through the experience and the value they receive. In turn, this helps develop better Net Promoter Scores.
6 best practices for SaaS dashboard design
Below are six best practices to help you create dashboards that meet user needs and drive business success.
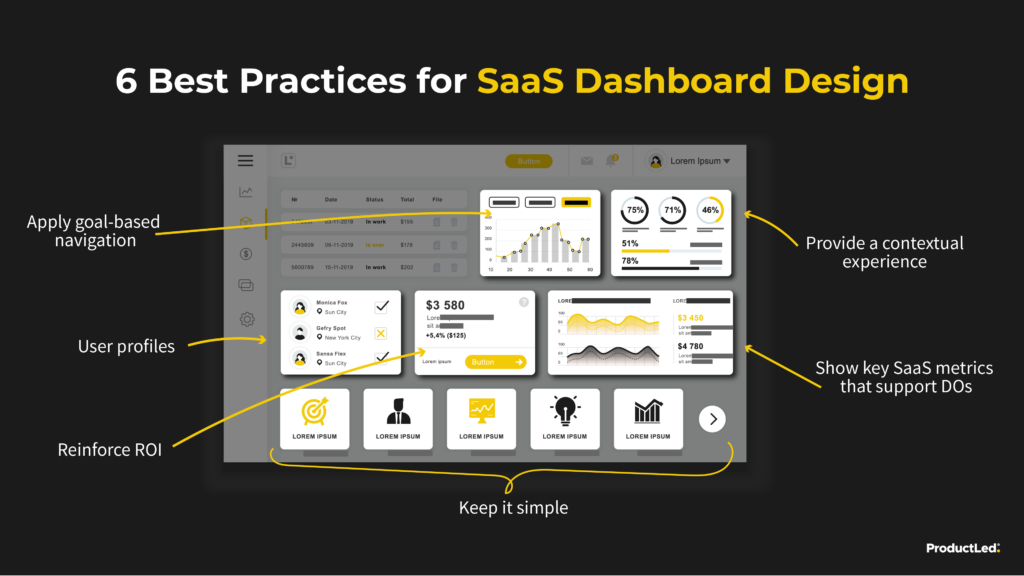
1. Define user profiles
Identify your different user profiles and their goals.
Your company is never going to achieve 100% user satisfaction. However, if you can cement your users into market segments, it’s possible to make incremental improvements to your SaaS dashboard and satisfy the majority.
2. Provide a contextual experience
Users continue using software that adapts to their needs and gives them solutions to problems that are within reach of their fingertips. For this reason, ongoing efforts to provide a contextual experience are good for business.
Present relevant and up-to-date information on the dashboard that is sensitive to the user's current situation. This can enhance the user experience and make the dashboard more valuable.
3. Apply goal-based navigation
Goal-based navigation refers to a user experience design approach that guides users through a specific journey or process to help them achieve their desired goals or outcomes. Doing so involves structuring the navigation and user interface to prompt and encourage users to take the necessary steps to reach their objectives.
This approach aims to make the user journey seamless and intuitive, ultimately improving user satisfaction and success in achieving their goals.
4. Show key metrics that support desired outcomes
Every SaaS product has users with desired outcomes. If the results users search for are clearly defined, your company can gear up your dashboard with key metrics to make it easy for them to achieve their goals.
5. Reinforce return on investment (ROI)
A well-designed dashboard can show users the ROI of using a SaaS product.
By showcasing the ROI on the dashboard, SaaS companies can help users understand and appreciate the value they are adding, making it easier for them to justify the investment in the tool.
6. Keep it simple
Simple UX design features are crucial to effective dashboard design.
Avoid information overload and prioritize the most important information. Use a clear and intuitive layout that is easy to navigate.
In the next section, we'll observe these SaaS dashboard design best practices in action through real-life examples.
SaaS dashboard examples and what makes them effective
SaaS dashboards by Holded, Personio, Geckoboard, ForceManager, Adzooma, and ProductLed showcase unique elements.
1. Holded (enterprise resource planning software)
The noteworthy aspect of Holded's dashboard lies in the tailored customization they’ve input into each design for its different user profiles.
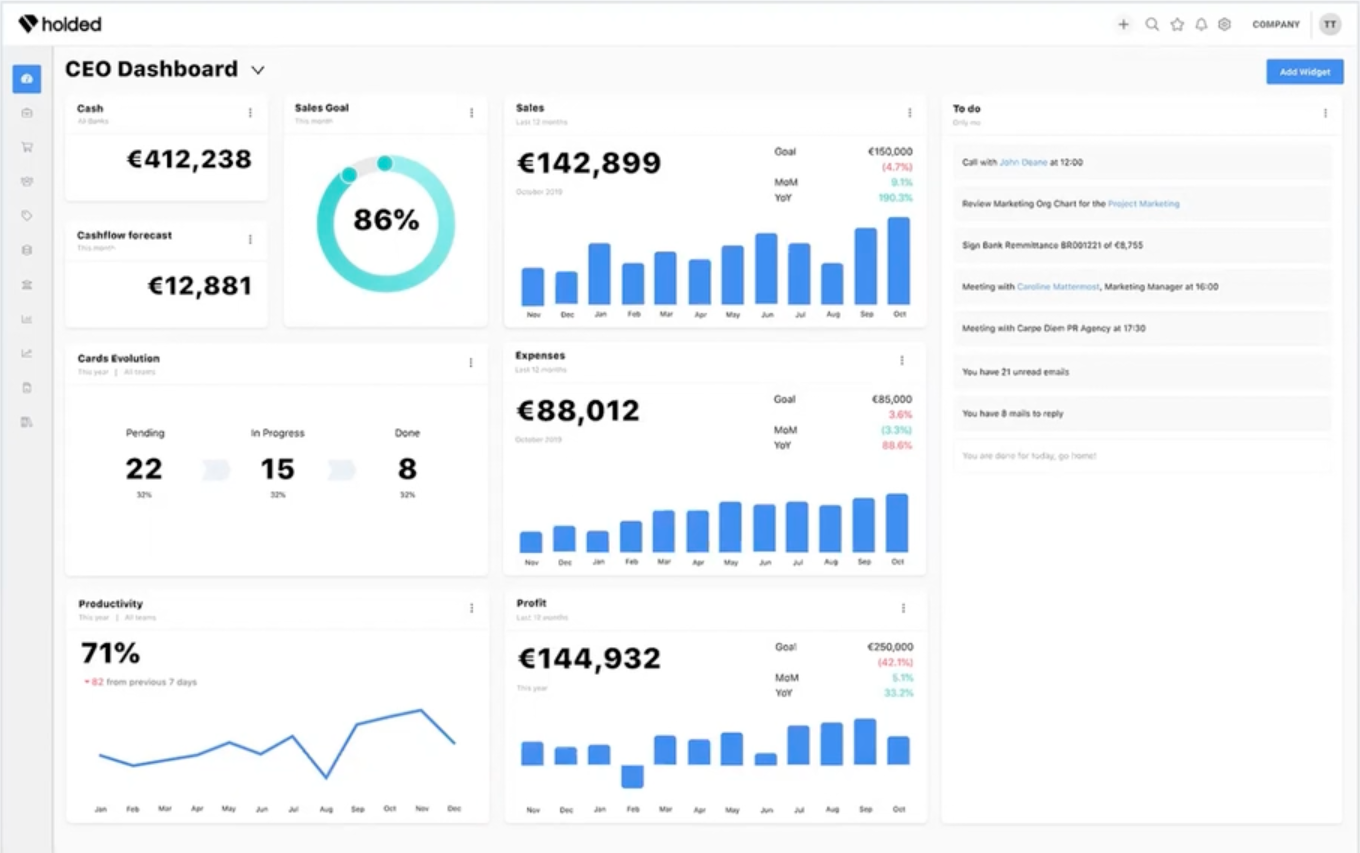
Dashboard custom feature summary:
- The job titles of employees within a company who are using the software.
- Various graphs, charts, and reporting features display key metrics important to each user.
- Effective color coding to “green for growth” and “red for decrease.” This design feature helps a user track their performance goals.
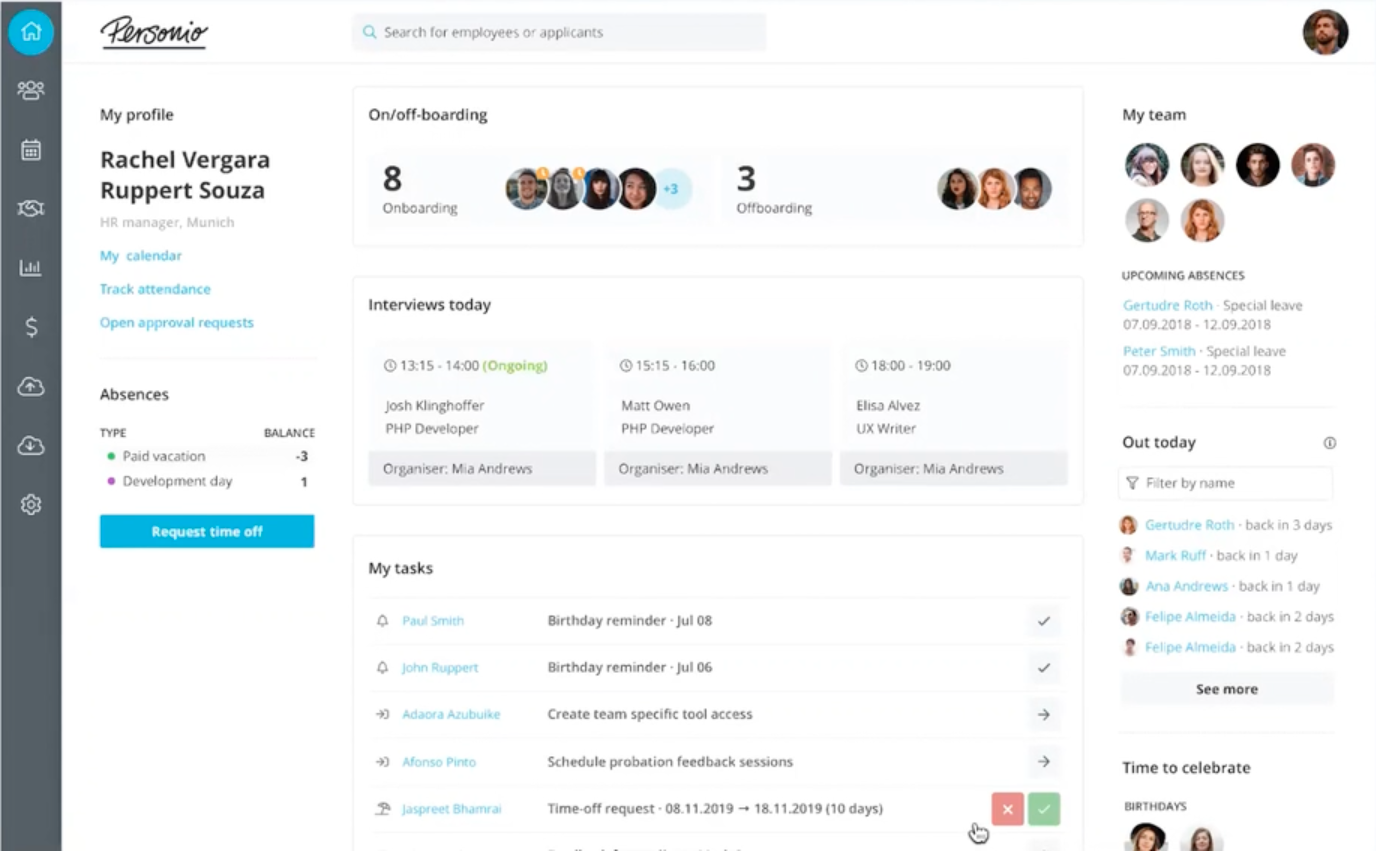
2. Personio (HR software solutions)
The dashboard of Personio incorporates tailored, adaptive data that serves the ever-changing needs of its users. The contextual experience they offer clients helps people management software stand out from the competition and be one of the fastest-growing SaaS companies in Europe.
While designing its dashboard, Personio conducted user interviews and learned that HR managers need relevant information sensitive to their current situation. This actionable insight ignited plans to create a contextualized experience.
Upon log-in, HR managers access their Personio dashboard for updates on:
- Daily employee information about who’s in the office, out sick, and on vacation.
- Alerts for upcoming tasks or company events.
- Notifications about interviews and staff performance-related reviews.
- Training details for new staff.
3. Geckoboard (metrics monitoring software)
Geckoboard recognized that new users struggled to create a dashboard the first time, so they turned to a goal-based navigation solution.
First, Geckoboard identified:
- Their User’s Goal: To create a dashboard
- Their User’s Desired Outcome: To handle their business metrics
Then, using this insight, the company developed a goal-based dashboard experience to serve its users better. The instant a new user creates an account and logs in to Geckoboard, they are led through a clever journey centered around navigation. Each step prompts the user and encourages them to achieve their goal of creating a dashboard.
The image below is a sample Geckoboard customized with key metrics such as website sessions, the number of units sold, average sales, social following, conversion rates, and more.
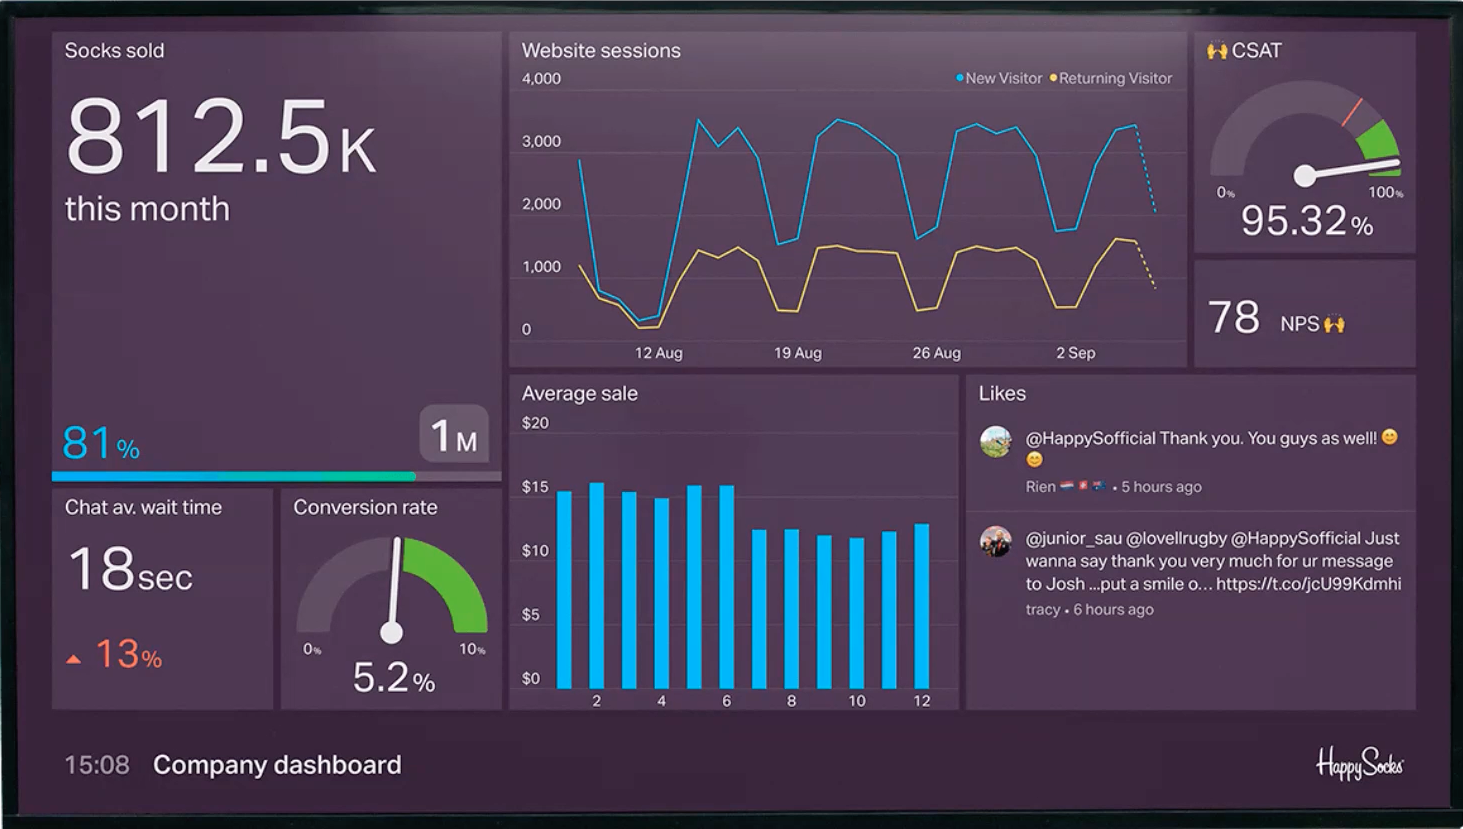
Like Geckoboards, SaaS dashboards should be hubs that provide users with the navigation they need to achieve their goals.
Problem-solving through user research
The Product team at Gechoboard conducts user research. From this research, they collect quantitative data like where the drop-off occurs and areas of friction that help them identify the problems that users experience.
Then, qualitative data is collected to figure out how to solve these problems. For example, the company’s products team interviews its users to understand what made them struggle at a specific step and not complete the task. Once they have enough insight into all these different users and their unique circumstances, they can apply that to the product to make the user journey seamless in a scaleable matter that works for all their users.
4. ForceManager (customer relation management software for sales)
ForceManager understands how important targets are in sales and has developed a dashboard for users to achieve their goals.
To successfully manage a team of outbound field-based salespeople, a company needs a convenient way to track SaaS metrics and monitor activity closely. ForceManager designed a dashboard with a mobile and desktop application. Doing so makes it even easier for users to enter or configure their dashboard with whatever key performance indicators (KPIs), reporting features, or usage requirements they need.
Every time a Sales rep logs in, they see their progress against their targets for the current month, week, or another specified period.
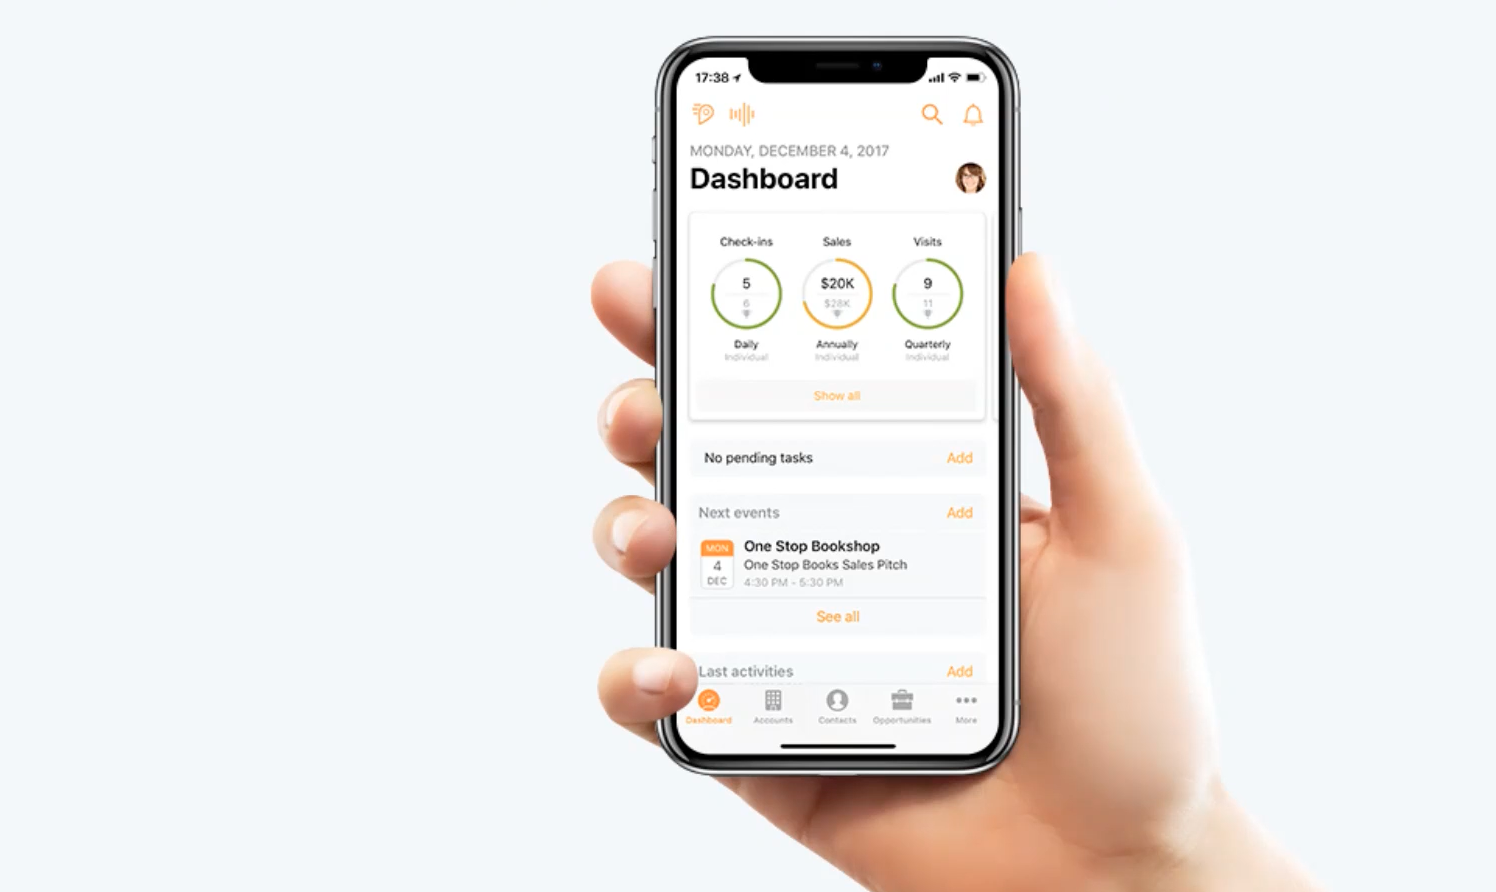
All the activity that a sales rep does within the ForceManager analytics dashboard is very goal-based and relates to moving company KPIs to hit targets. The dashboard is the information and reference point for everything related to the user’s desired outcome.
5. Adzooma: managing paid advertising software
Adzooma is a tool for managing paid advertising. A company can connect its paid ads with Adzooma to help them optimize and increase advertising efficiency. The company’s dashboard shows users metrics that indicate problems and success, but perhaps the most powerful information on display is the ROI.
Notice the blue widget on the prominent right-hand side of the company’s sample dashboard below. The data in this box shows the user all the work Adzooma does to improve its ad campaigns.
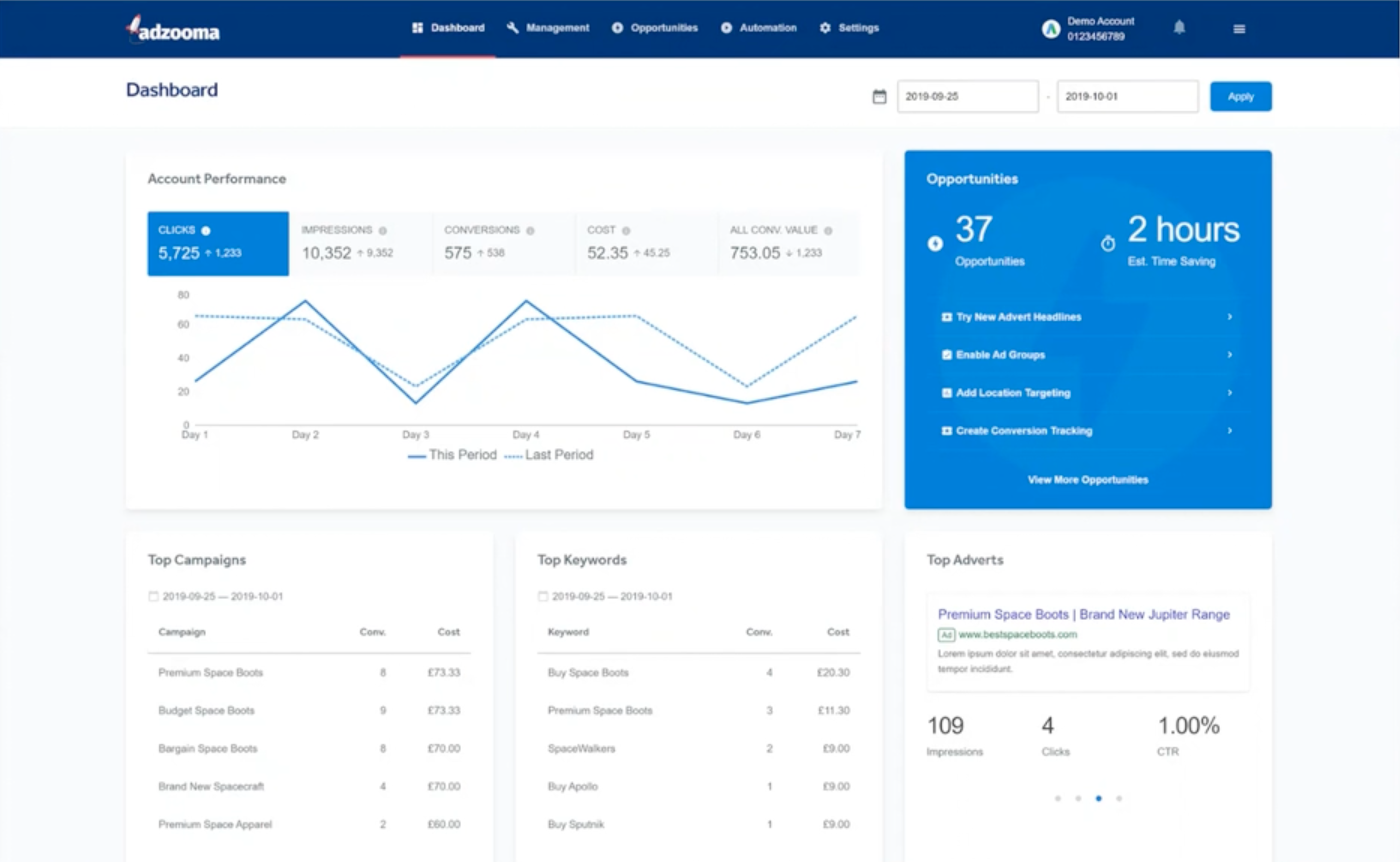
The blue widget demonstrates value to its users.
In this example, Adzooma has increased efficiency in managing user ads by creating 37 ad opportunities and saving them two hours.
By presenting users with snippets of how your software is beneficial, your company shows that you offer a solution to their problem worth the expense.
6. ProductLed Academy
When a user logs into ProductLed, the dashboard greets them with a video and then shares where they can find important information, such as previous coaching calls.
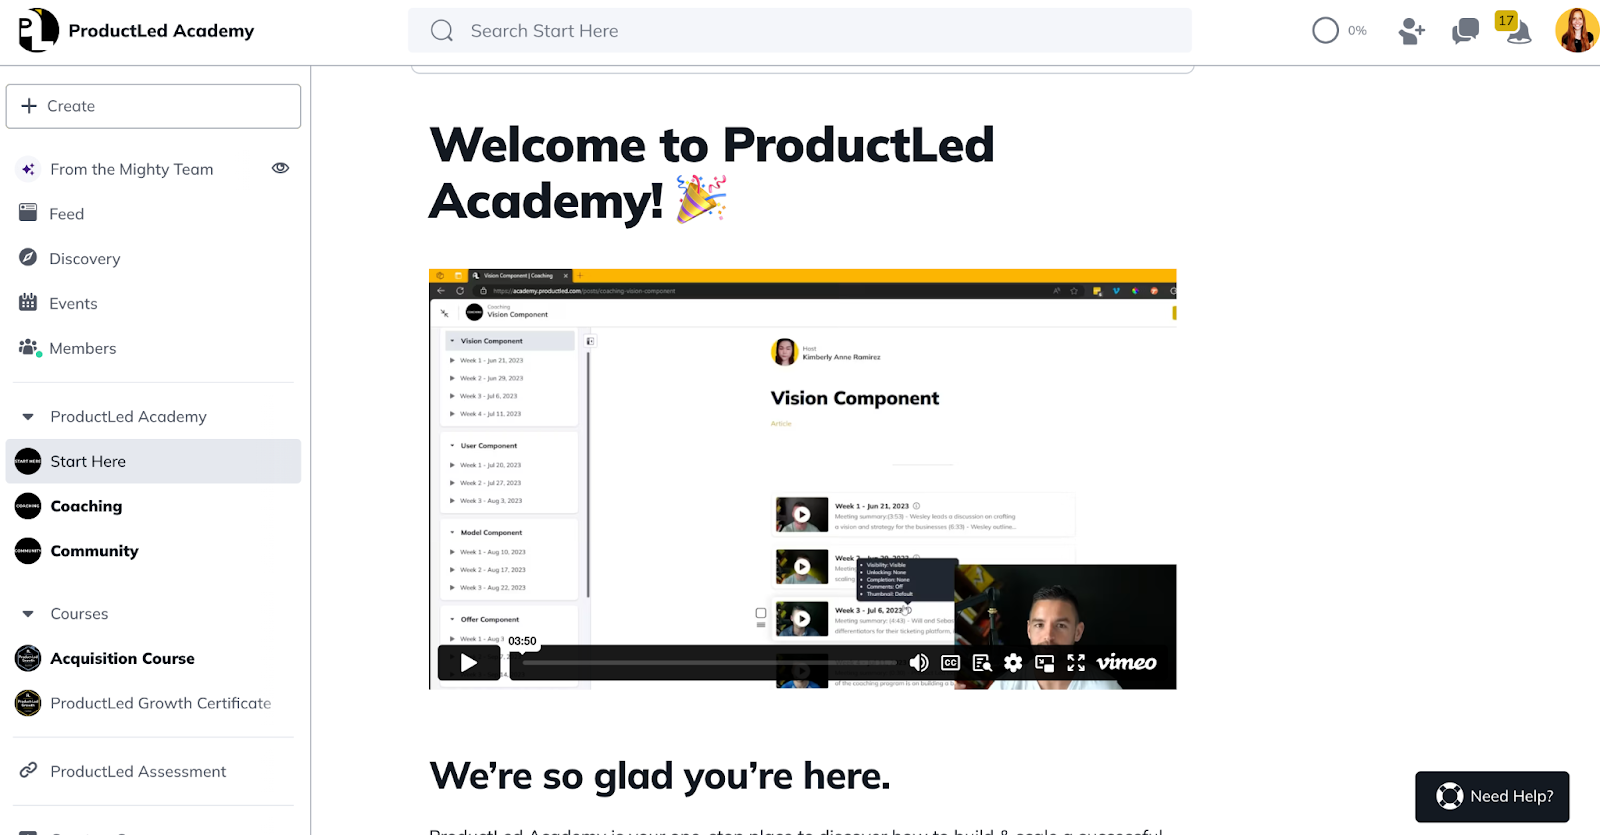
Users aren’t overwhelmed and are given an easy path to value.
Why it’s difficult to improve your dashboard
SaaS companies commonly deal with accommodating four or five distinct user profiles within a shared dashboard. The complexity arises when designing a user-based dashboard that effectively addresses each user type's diverse goals and desired outcomes.
Hiring SaaS dashboard example
A job candidate, human resource (HR) manager, and CEO log in to the same dashboard, but each individual has different experiences.
- The applicant needs access to the candidate-facing part of the software where they can attend the interview. They also need the job description, salary details, resume submission deadlines, etc.
- The HR manager must monitor and track job applicants through the interview process.
- The CEO may log in to review how the hiring process is going and check in on the status of stand-out candidates.
A value-based dashboard design needs to satisfy the needs of all its user types.
5 common SaaS dashboard mistakes that hurt users
Design improvements can go a long way to improving your SaaS dashboard.
Let’s look at the London Transport Dashboard to pinpoint issues that might impede a positive experience for users.
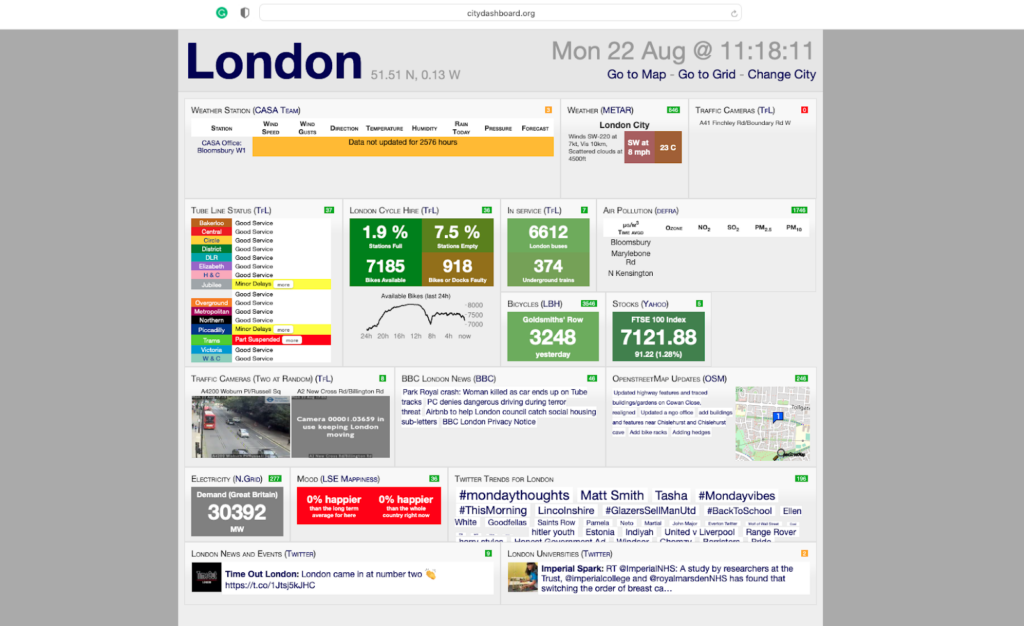
What words come to mind when you look at the website’s dashboard above?
Overwhelming. Busy. Information overload.
If so, you’re not alone. This transport page does not have great UX.
Here are common mistakes product-led companies should avoid when designing their interactive dashboards:
1. Too much information
Cramming information onto your dashboard overwhelms users. Choose quality over quantity. Think about what type of information each user profile will benefit most.
2. Confusing hierarchy
The presentation on your dashboard indicates the most important information and draws attention to features that help users achieve their goals. Elements of site hierarchy include menus, icons, ordering, and dropdown lists.
3. Different fonts
Various small and large fonts make a SaaS dashboard confusing to users. Instead, use uniform sizing for headers, sub-headers, and body text.
4. Poor layout
The layout of a platform makes a visual and functional impact. A dashboard layout gives users a good or bad first impression and guides them to a solution for their problem (or not).
Visual points of interest that guide users through the software are the foundations of a dynamic and goal-oriented dashboard design.
5. Conflicting colors and sizes
A glaring design flaw in the London City Dashboard (in the image above) is all the different colors for header and font types. Establishing a color scheme, standard font type, and proper alignment helps create a balanced dashboard layout.
How to create a value-based dashboard
Company dashboards provide the framework to help users achieve their goals.
Think of your software as the tool providing a framework that leads the user to their desired result and outcome.
A transparent, thought-out system must be in place when you start building a framework for your product. This system should increase utilization, retention, and your Net Promoter Score, enabling you to market your product better.
Once you have a very well-designed dashboard, it's easy to share that as a graphic as a sales tool for prospects to visualize using your platform.
5-step value mapping exercise to improve your dashboard
My value mapping exercise helps you consider all the elements to design a powerful SaaS dashboard.
As we review the five steps detailed below, please reference this example exercise Value Mapping chart below.
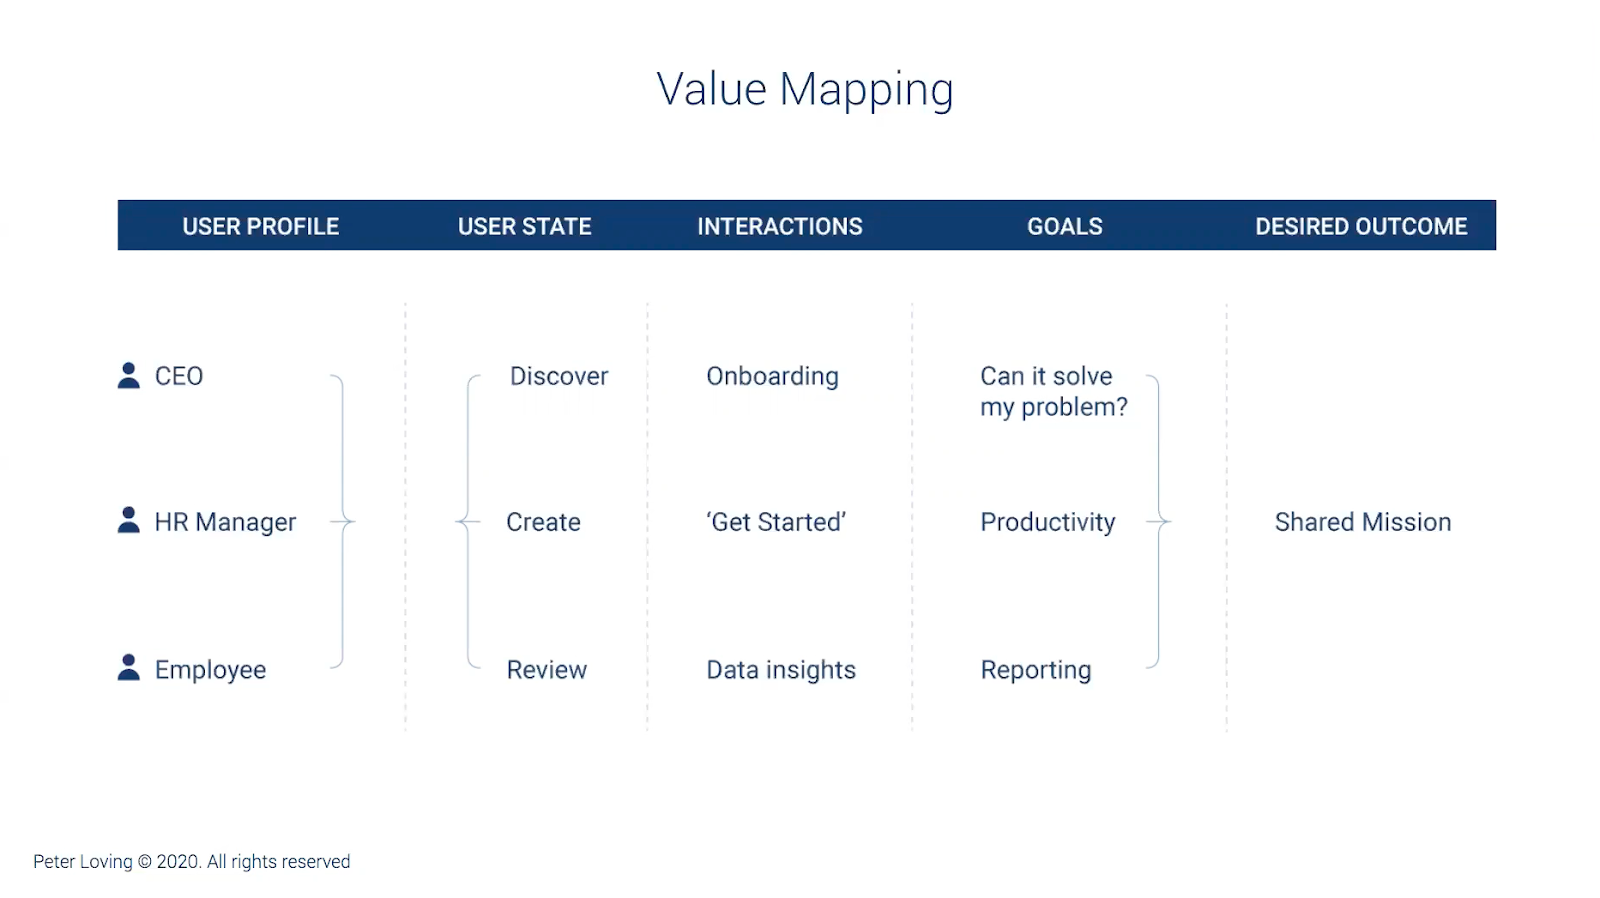
1. User Profile
First, brainstorm all the user profiles your product serves. Make a list of these profiles in the first column labeled USER PROFILE. (Reference example exercise chart above.)
2. Desired Outcome(s)
The DESIRED OUTCOMES are on the far right of the chart. In this column, list the desired outcomes for each user profile – they might be the same or different for each person.
3. User State
When a user logs in, they are in one of three different states:
- Discover: Users in a "discover state" want to learn more about the product.
- Create: Users in a "create state" are informed and ready to use your product.
- Review: Users in a "review state" have used your product and want feedback in the form of progress updates, reports, etc.
Write a state for each user profile in the second USER STATE column.
4. Goals
Next, fill out the GOALS column.
Think about your users based on what state they're in. How does that goal lead to satisfying their overall desired outcome?
5. Interactions
Finally, in the INTERACTIONS column, write the physical interactions the user needs to go through to reach that goal that ultimately works towards the desired outcome.
How effective is your SaaS dashboard for onboarding new users?
Your dashboard plays a crucial role in shaping a new user's first impression — and ultimately, your product’s growth. When designed with intention, it can drive clarity, reduce friction, and guide users toward value quickly.
But here's the problem: most companies still don’t understand their users well enough to design a truly effective onboarding experience. Why?
- They treat buyers and users as if they’re the same
- Their customer research is a one-time effort
- They lack a clear Ideal User profile
If any of these sound familiar, it might be time to reevaluate your approach. Start by taking the PLG readiness assessment — it’ll help you spot where your onboarding strategy is strong and where it needs work. Or if you’re further along and looking to tighten your execution, schedule a strategy session to map out next steps with a ProductLed expert.
For more support, explore the ProductLed MBA, read The Product-Led Playbook, or work directly with a ProductLed Implementer to put your learnings into practice.