Data is amassing in product-led growth (PLG) companies worldwide at an incredible rate – which has the potential to set new standards for data-driven innovation. But can company cultures keep up with this newfound potential?
Product-led organizations often don’t know what KPIs to track or aren’t integrating their data in a streamlined way. Bottlenecks form, and hastily put together standard operating procedures are implemented.
Data-driven organizations grow an average of more than 30% annually and have a 5 to 6% higher output and productivity than their less data-driven counterparts. Still, many organizations are slow to integrate this new approach.
Who wouldn’t want to experience exponential growth?
In this article, find out how Heap successfully integrated a new data-driven culture and how other SaaS companies can do it too.
What Is a Data-Driven Culture?
Simply put, a data-driven culture is one where employees use analytics and stats to optimize different areas of work. Leadership knows and understands the importance of data, and they prioritize processes that collect and dissect data to make the best use of it.
Good data helps PLG companies:
- Provide clarity on areas for improvement.
- Signal to leadership what goals need to be adjusted. l
- Objectively show teams what’s working and needs more exploration.
A data-driven culture requires the collective behaviors and beliefs of PLG companies to value data and improve decision-making by using it.
Building a data-driven culture in a product-led work environment is crucial for success. But without the right analytics, teams can get lost when looking for the next best move.
Proactive vs. Reactive Analytics
Analytics is a lot to take on. Many PLG companies don’t know where to start.
At times, teams seek answers to questions, while at other times, they want a broad understanding of how a metric performs. But what details are important? What are the problem parts? And where should you look in onboarding?
Two ways to start approaching your analytics are with:
- Proactive Analytics: When a system gathers data and proactively recommends areas for deeper analysis or points out issues that surface.
- Reactive Analytics: When checking on new features or certain areas of the organization, teams might react to a shift or change that needs their attention.
The key difference is how you approach the data: ahead of the curve or reacting to a change that needs attention.
Proactive Analytics
When making data-driven decisions using proactive analytics, it’s after the system has gathered data. Your data collection tool can pinpoint areas where dropoff or other problems in onboarding are occurring so you can fix them.
Proactive analytics is about driving to the action and systematically collecting data.
Essentially the approach is automating insights. The team member running the system or managing the dashboard might find the insights, but it could take time or go astray.
Proactive Data-Driven Approach Example
Usually, when you have a form, you measure analytics during user onboarding. You want to see how people move through the funnel, but you don’t want to get caught looking at every form field.
All you need to know is the following:
- Did they start the form?
- Did they finish the form?
- Did they do the next step?
Hone in on a problematic field where an error is occurring and make a proactive insight. For example, 50% of users are dropping off at this call-to-action. Then, use this insight to develop a solution.
Reactive Analytics
Reactive analytics are useful when you need to respond to an action or distinct user behavior. This scenario might arise if teams regularly review KPIs or release a new feature.
Launching a new product feature requires a baseline; figuring that out is part of the reactive analytics post-release.
Similarly, with KPIs, if teams notice a jump or shift, they would address that change with data-driven decisions.
Reactive Data-Driven Approach Example
If your PLG company launches a new feature, for example, you will have to check the metrics to understand how it's performing. Doing so is about looking at performance and discovering a fixed reference point for launching something new and less about identifying a specific problem.
As highlighted in the example above, tracking fingertip metrics – or KPIs that you review weekly or monthly – is good practice for collecting reactive analytics.
If you don't have a proactive approach, you may be missing insights and spending more time trying to find them.
How to Gather and Integrate Data Points
Gathering data is only useful if you know how to integrate it successfully – to solve problems and produce actionable insights.
Here are three methods to gather and integrate data in your organization.
Combine Quantitative With Qualitative Data
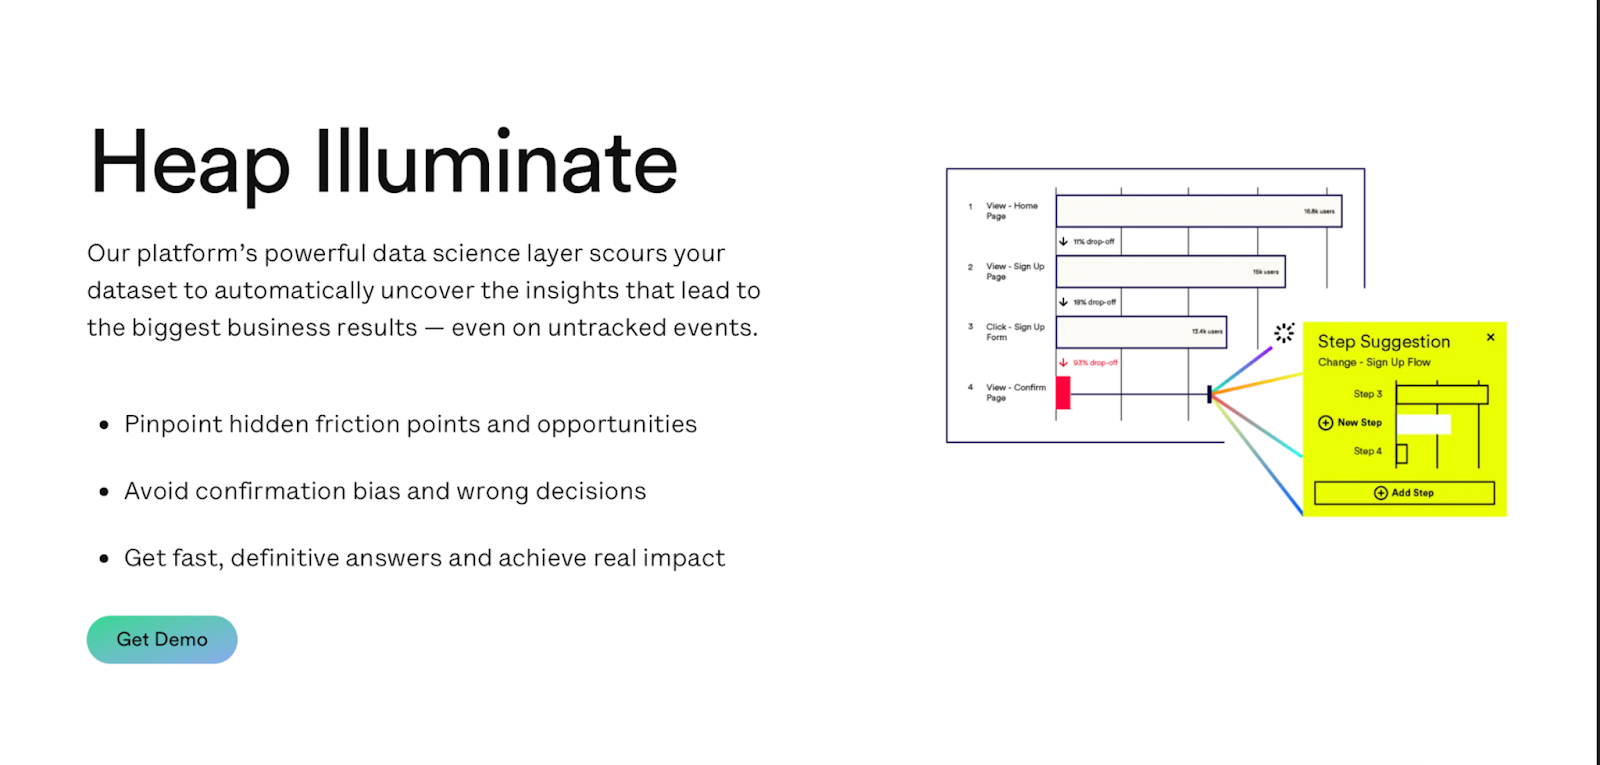
Heap launched a data science capability called Illuminate. The platform uncovers points of interest in the data, such as:
- Finding one part of the field that's broken.
- A step missing in your analysis of a funnel.
- Other issues that come up with variables in campaigns.
Using tools to observe the variation in performance or changes in certain variables is only made more powerful with the integration of qualitative data.
Talk to customers, conduct surveys, and look at user behavior. Doing so will help round out your data and make it easier to lead to actionable insights.
Figure Out the Problem and Narrow It Down
PLG organizations need to locate their problems before they can fix them. Narrowing down the root issue through data-backed analytics allows teams to recover and resolve the issues quickly.
For example, at Heap, to find the problem in a funnel, we first discover where it's happening. Then we can look at a visual of what the user is doing at the site of the problem. From here, we can connect the user ID with the problem to an actual qualitative representation of what’s happening.
By knowing what the quantitative data looks like in real-life applications, organizations get a deeper understanding of the issues. This data also helps promote collaboration between departments.
Use a Data-Driven Culture to Integrate Fingertip Metrics
Fingertip metrics – routinely tracked KPIs – were introduced in the Reactive Analytics section above. It’s helpful to have a consistent system in place to measure essential KPIs that will provide clear data over time.
Measure fingertip metrics on a regular weekly or monthly basis. This gives a consistent set of trends and makes it easier to spot irregularities.
Changes in steadily tracked data allow you to pinpoint problems, narrow your focus, and leverage the power of combining qualitative and quantitative data.
The Challenge of Building Your Own Digital Insights Platform
It’s impossible to predict every potential issue that could arise when your product-led company is developing its SaaS platform.
Let’s dive into two common roadblocks and how your team can overcome the challenges.
Knowing Ahead of Time What to Track
A lot of technologies require that you know ahead of time what you want to track. But most teams will not necessarily track every single form field or every single error code.
Tracking often starts with more general goals – to know what's happening in the big picture. It's a lot of work to track individually. You have to ask the Engineering team to implement tracking for all the different codes and so on.
Solution: Automatically Track All Metrics
Heap automatically tracks specific KPI metrics we know we want but also additional ones we don’t necessarily need. Problems can always arise in blind areas of your onboarding process.
Not every user follows the happy path. This is why it’s awesome being a digital product owner. What you're doing is building net new customer journeys.
PLG companies can never know every failure mode that will come up. The users will take unexpected turns during onboarding that you would never imagine.
What's great about this approach is that the system collects all the data, so you don't have to overthink, and discover what you couldn’t have previously imagined.
Collaboration Between Departments
Another common challenge in product-led organizations is cross-team communication regarding data. The User Research or Product teams will have access to the product data, but it also affects Sales, Marketing, and other departments.
So how can you ensure insights get shared across the entire organization instead of siloed within separate teams?
Solution: Align Around the Data
Data is a fantastic equalizer. It’s a great tool to align and bring departments together to maximize the power of teamwork.
At Heap, we want new prospects that visit our site to try our product and get value quickly. Achieving this goal takes cross-functional effort, that’s crucial for product-led growth.
Team alignment needs to correspond with the data. Ask the following questions:
- What data are you trying to drive?
- How will you make sure insights are shared across the organization?
The conversation doesn’t revolve around who should work on what. The key is to agree on how to measure data, move metrics, and plan the strategic steps forward.
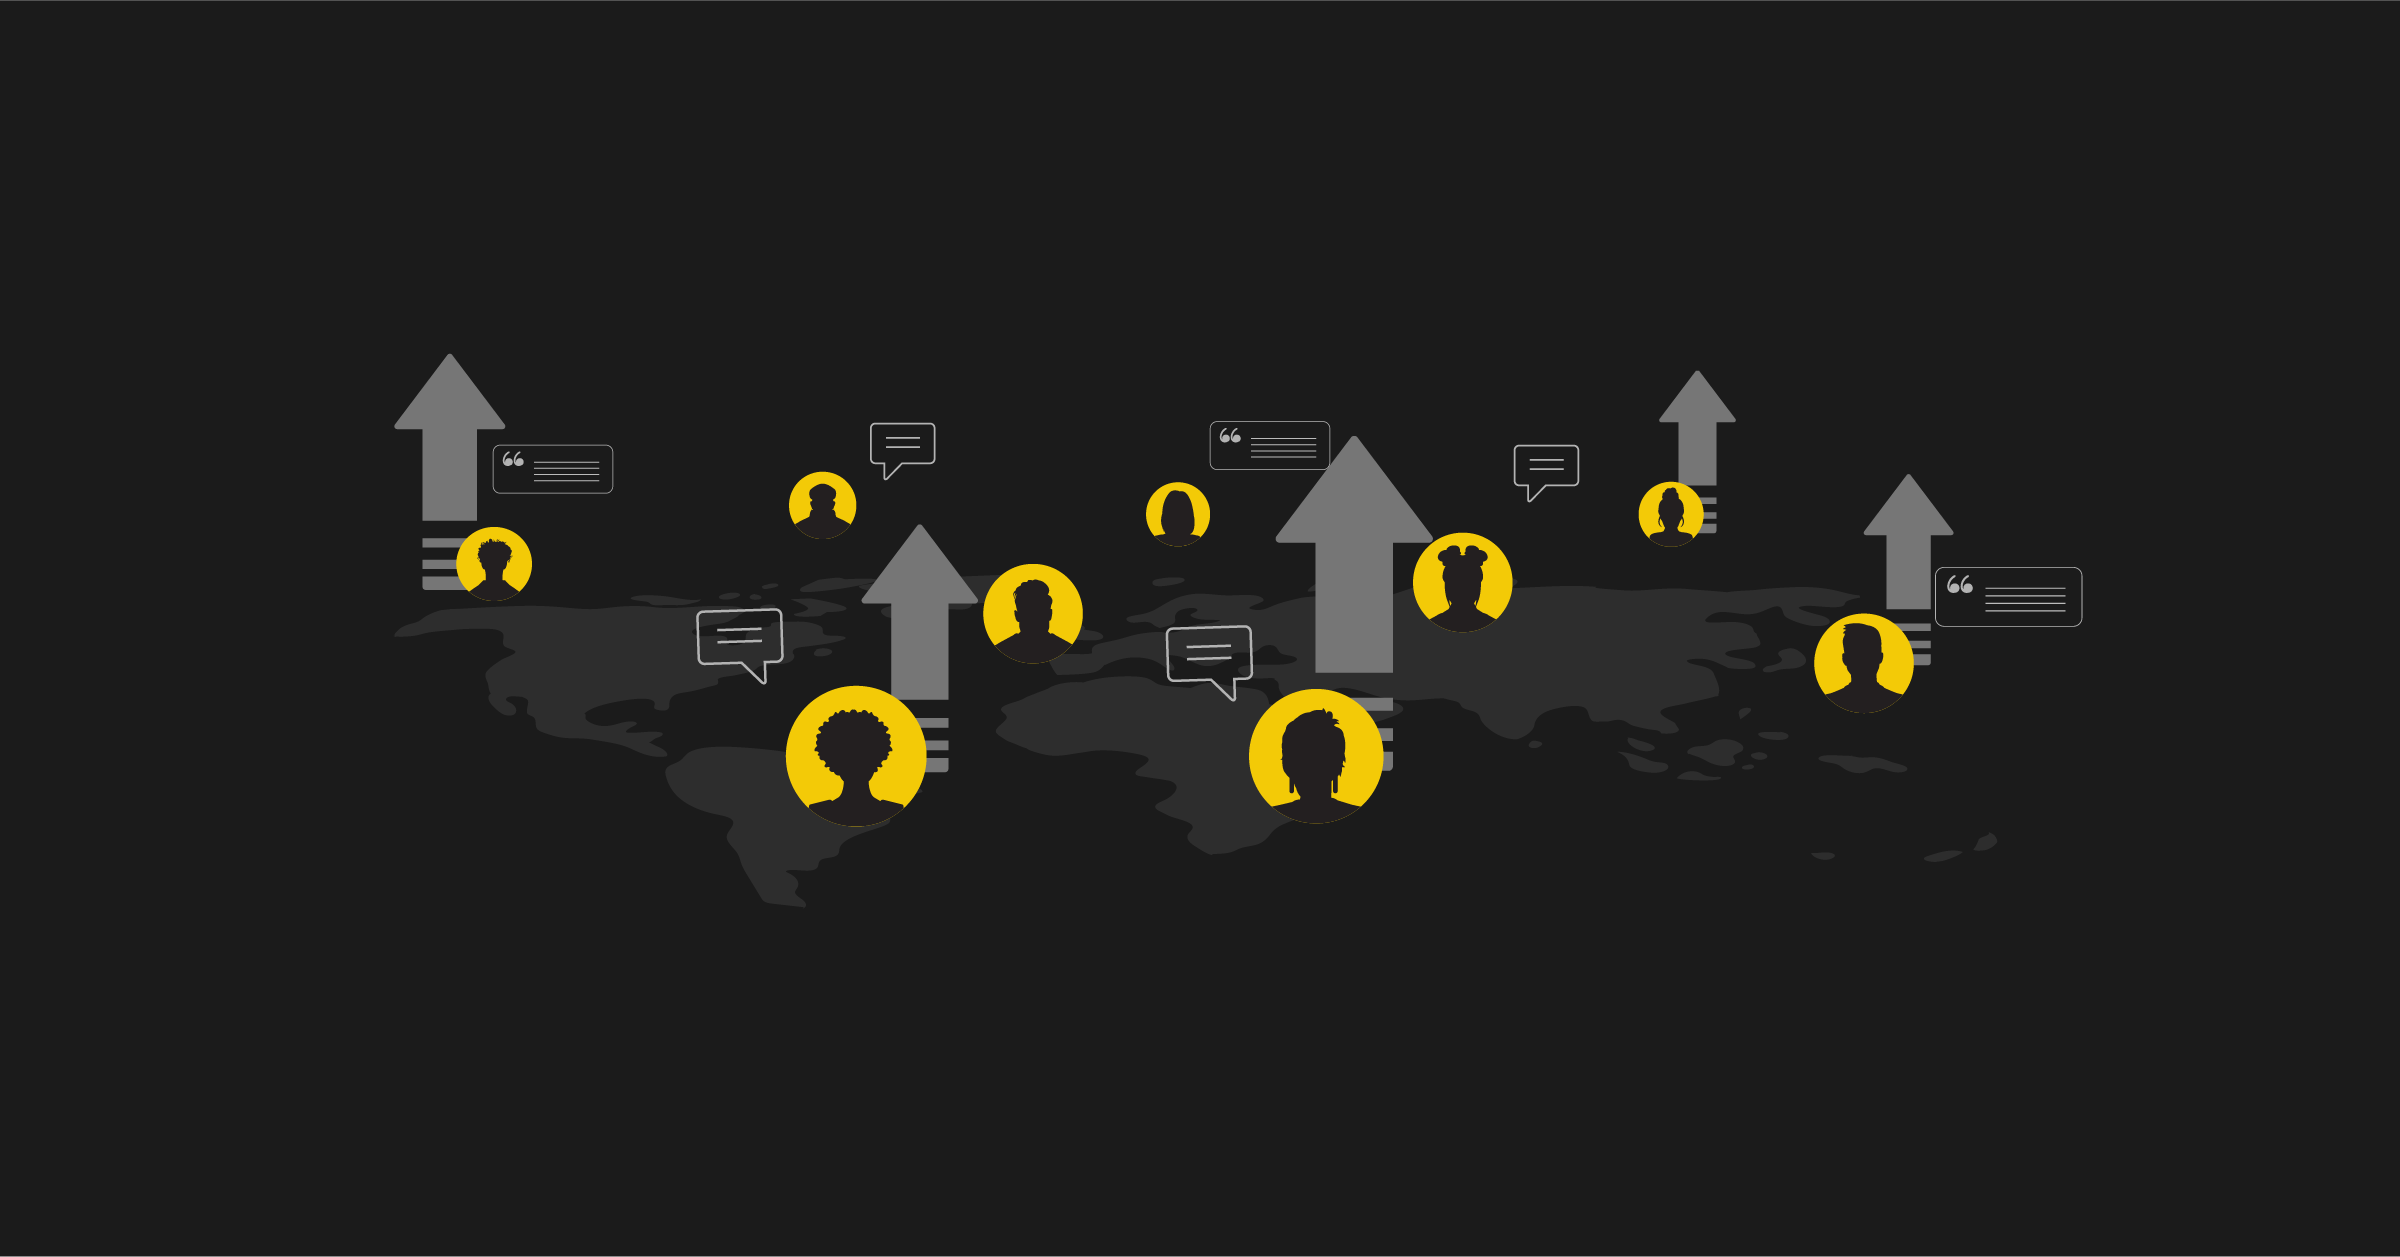
How to Align Different Teams in an Organization With Data-Led Culture
Data is a great equalizer and a way to align teams.
Aligned teams need to focus on how they can collaborate to move a metric instead of making siloed decisions on what they think would work best.
For PLG companies, getting your prospects to try out your product is essential. To find value, they need to experience real use cases.
A cross-functional effort across Marketing and Product brings in new users,, and you need to evaluate how they use your product. It’s crucial to operate in line with one another’s goals.
The success of alignment hinges on an organization agreeing on the data and ensuring that it’s being shared across all teams.
How to Create a Data-Driven Product-Led Growth Company
The biggest obstacles to setting up and developing data-driven PLG companies aren’t technical, and incorporating data into a decision-making process isn’t complex. Instead, the hard part is initiating the cultural shift that requires a robust and unified effort.
The habit shift presents the biggest challenge for organizations.
How can you normalize all teams in a SaaS company to be data-driven in every effort?
New Graphic
Here are some strategies:
Baseline Your Metrics
When aligning teams and embarking on product-led growth, it's essential to baseline your metrics.
Organizations need to understand where they are starting before they can start improving their metrics. If you don't have a baseline, you don't know what your impact has been.
At Heap, our first order of business was gathering all the data when starting our trial experience. We knew we could risk hurting another metric if we didn’t know our starting point.
Start at the Top to Be Truly Data-Driven
Companies that embrace data-driven cultures have leaders who set the standards for decision-making based on data. Senior managers who back data-driven cultures set an example by insisting that data-based decisions are standard practice.
General practices established by leadership spread downward and influence company-wide norms.
When employees communicate with senior leaders about data, they can use terms and language that make an impact because they have a clear roadmap.
Consistency Trumps Flexibility
In the short term, trade flexibility for consistency if necessary.
Companies that rely on data may have several data tribes. Each tribe may use different measurement techniques, unique metrics, and exclusive programming languages.
When organizations use subtly different versions of a single metric, it can take a long time to resolve. For example, modelers working in inconsistent coding languages and standards take a toll on the work process.
It’s challenging to share ideas internally if they must be translated every time. SaaS companies should establish canonical metrics and languages across the organization.
Make Data Cross-Departmental, Don’t Leave It in a Silo
Organizational silos often guard data in many companies.
Silos inhibit data correlation, and different departments usually keep their own sets of data. The reason usually comes from a legitimate place: to ensure that other teams understand the context, variables, and patterns of specific data so that it isn’t misused.
Rather than denying other teams access to data, turn these experts into educators. When departments take ownership of educating and helping others in a PLG model, the organization’s data literacy significantly boosts.
PLG companies can be more dynamic and make the most of data by creating data governance structures that empower different teams.
Put Intentional Training to Use
Companies often invest in large-scale training efforts, only for employees to forget what they’ve learned if they don’t put it to use immediately.
Employees should receive specialized training just before they need it. Learning specialized tools, such as statistical confidence or new analytical concepts, is more effective.
The most effective data-driven PLG training targets learning later reinforced with experience.
Learn Other Effective Strategies To Become Product-Led
Aligning leadership and teams around data is the key to building a data-led culture in PLG organizations. To maximize success, SaaS companies need to:
- Get ahold of and master their analytics
- Gather and integrate essential data points
- Observe and rally against challenges
- Align different teams in the organization
- And focus on the fruitful goal of building a healthy data-driven culture in their PLG organization
To hit the ground running, grab free resources like the PLG fundamentals course and get clarity on the first steps. It’s a complex journey to becoming successfully product-led – and it’s the future.

.avif)