Determining the right key SaaS metrics to measure at the right time is crucial to the success of your company since the margin of error is so tiny.
Traditional top-down sales are not like product-led models. A SaaS company with only 20% growth has a 92% likelihood of not making it past its first few years of business.
In this article, we’ll unpack how to determine the key metrics your company needs to scale quickly and what automated tools can help during every growth phase.
Let’s start by looking at how actual SaaS companies established their key metric to create more paid conversions.
3 Examples of #1 SaaS Metrics From Real Companies
Paying users usually have one to two actions in common. About 80% of users often do one action, while 20% do the other. Hence, if you can mimic this behavior for every user who signs up, you win the game.
This approach is how you discover your #1 key SaaS metric.
1. Planday Example
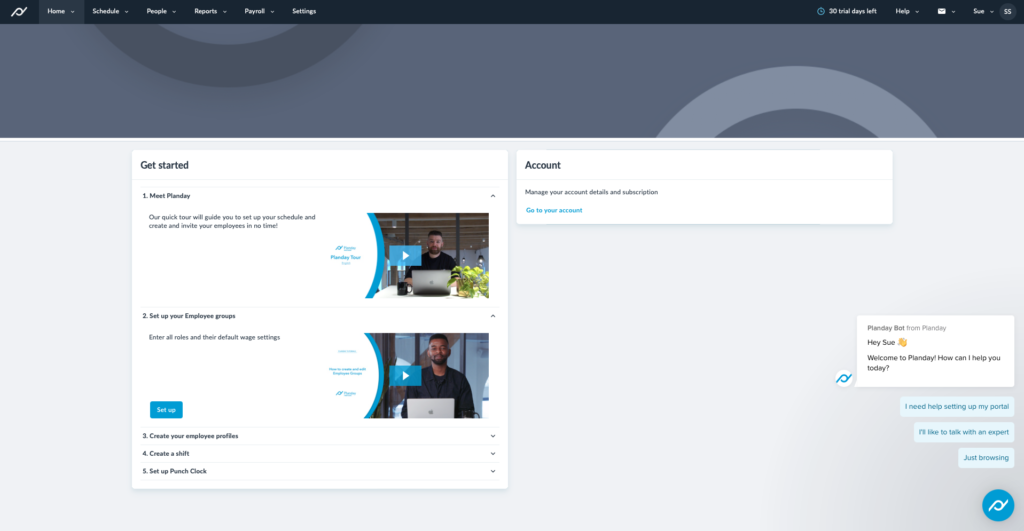
Planday is an hourly shift worker software. The likelihood of a user becoming a paid customer increases by 70% if they invite another employee.
When a new user logs in, “Set up your Employee groups” is the second menu option on the company’s dashboard.
Let’s think about that.
Why would it be important for somebody to invite somebody else to a platform?
It’s much harder for a company to cancel any type of contract with a tool or service that other employees use.
So that’s Planday’s #1 metric.
2. LetsBuild Example
LetsBuild is a construction management software company. If a user uploads a project, the likelihood of them becoming a paid customer increases by 60%.
Therefore, their #1 metric (and goal) is for everyone to upload a project.
To encourage this action, LetsBuild makes it easy for users to download data instead of entering it manually. Doing so removes the number of steps it takes to upload a project. The company also changed all its messaging features to “Upload your project.”
3. Actimo Example
Actimo is an interactive mobile-first employee platform. Once a user logs in and creates their first message, there is a 35% likelihood of becoming a paid user – so that’s their #1 metric.
To achieve this, they shifted their approach to automated messaging.
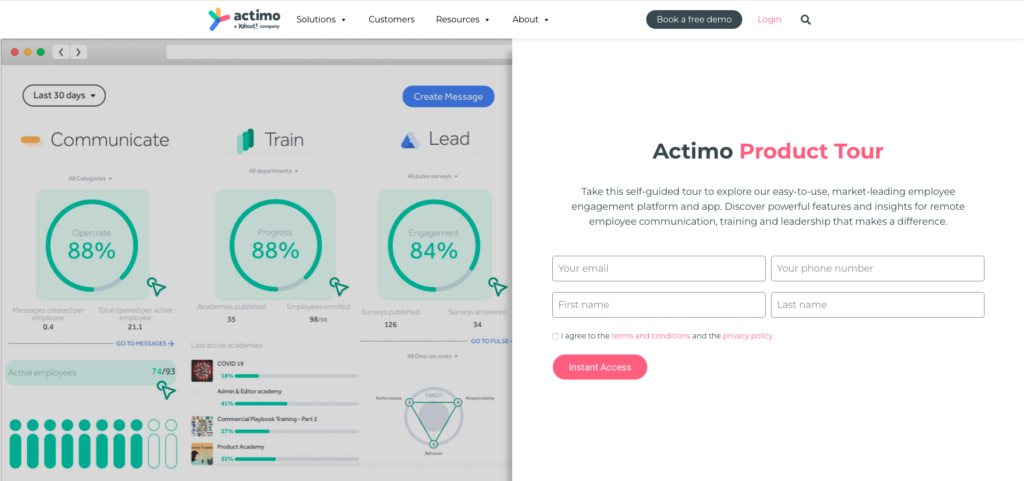
When a user logs in, a message automatically populates. This action reduces the time-to-value and allows the user to send that first message easily.
A Few Tips Before Choosing Your #1 SaaS Metric
Let’s review some marketing fundamentals in preparation for choosing an essential SaaS metric for your company.
Growth Hack = Doing The Work
Growth hack is a buzzword people throw around to exhaustion. But if you don’t work to understand how unique marketing efforts can be, it’s next to impossible to develop innovative solutions.
Marketing is about systems, so take time to learn them. Each leads to the next and gives you a comprehensive understanding of marketing programs.
Marketing Funnels
Marketing funnels are essential to understanding this article, so here’s a quick refresher.
There are many variations of marketing funnels, but a typical one creates interest, moves users into the “consideration zone,” and closes the sale.
Here’s a basic product-led funnel:
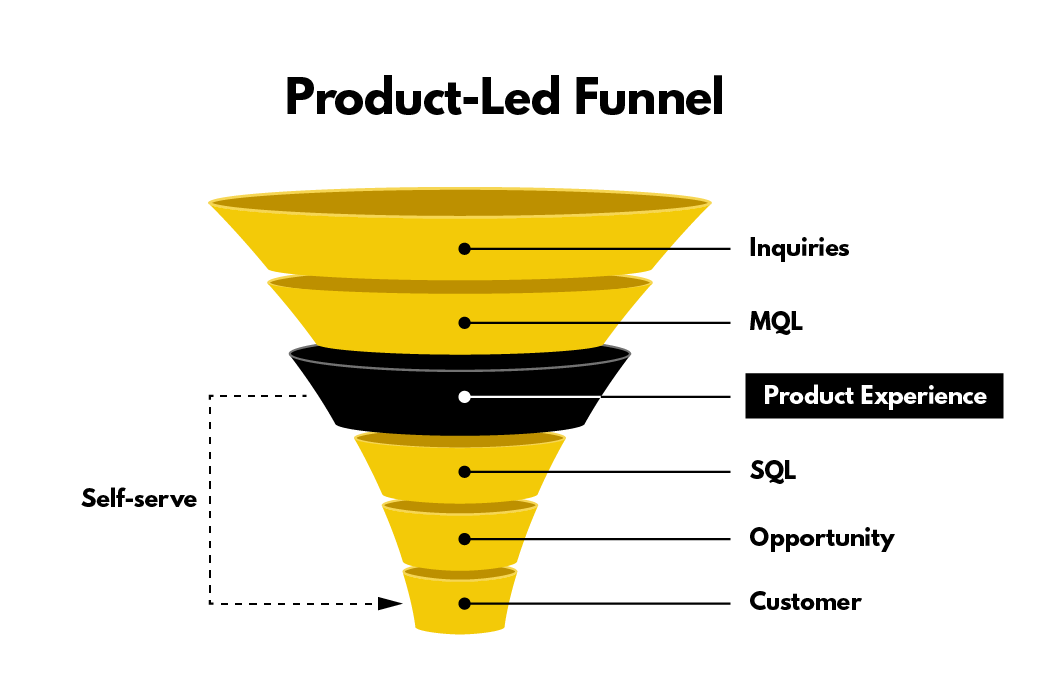
A basic marketing funnel attracts, converts, closes, and delights a customer.
Tools Are Just Ingredients
Think of tools and software as ingredients that affect the outcome of your data and how you respond. What are you trying to achieve? Pick the best tool to help you meet long-term company goals with the right key SaaS metric.
More than 7,000 automation tools saturate the market. The following section recommends the tools for segmentation, data enrichment, user journey mapping, behavior tracking, etc. Still, you can select any version that works best for your company’s needs.
How to Discover Your Most Important SaaS Metric to Scale Quickly
Let’s get into how to discover your #1 key SaaS metric with current tools on the market by looking at data collection, onboarding, reporting, and retention.
Data Collection
Data collection takes time and can feel daunting. But gathering as much data as possible can improve decisions on which users to focus.
For a full data set, let’s break data collection down into four stages: segmentation, CRM integration, user journey mapping, and measuring behavior.
Segmentation Stage
Segmentation is the idea that users who convert on a website are not the same, nor should they be treated the same.
Ideally, you want to target your ideal customer profile (ICP) and identify and track who that user is.
We call this lead segmentation.
Lead Segmentation
The level of urgency for a user who arrives at a website through an organic search is different than one enticed by a “30% off! Buy Now” advertisement.
Organic leads have a much higher probability of converting.
For this reason, you want to determine how visitors come into your funnel and start segmenting based on:
- The source.
- The medium.
- The commonality between current and past users.
The following tools automatically segment and collect data on the habits of your users:
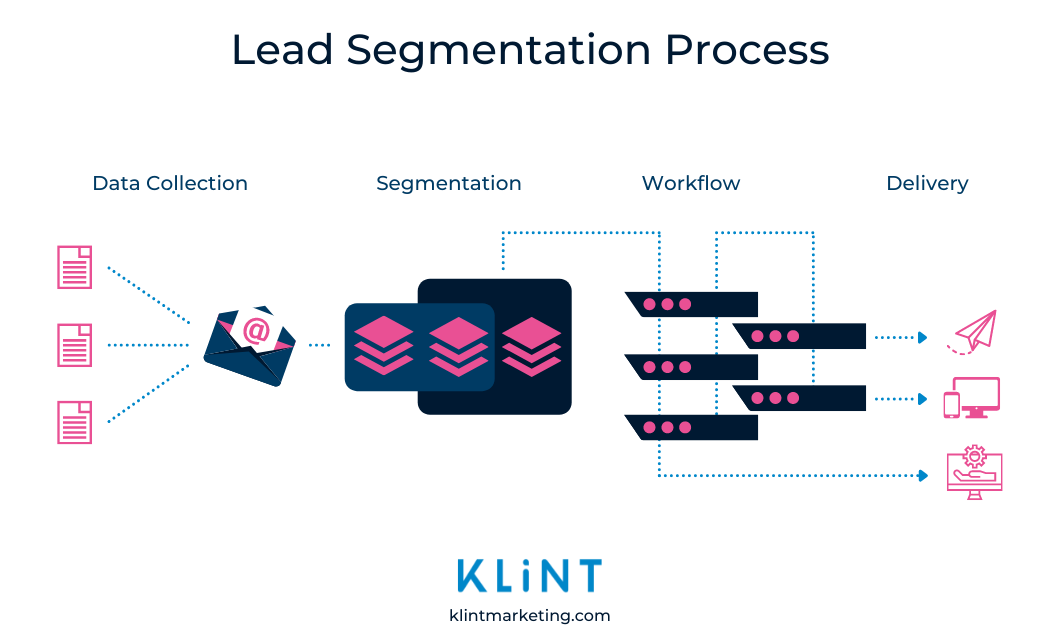
Direct an urgent call-to-action (CTA) to users who meet your ICP. You can, for example, build a workflow that constantly reminds the user about your product and the value they’ll get from it.
Reminding potential customers that you are there and ready is a pillar of successful marketing efforts.
Lead Scoring
“Book a demo” CTA tends to be a higher converting lead than “Sign Up Now.”
A prospect that clicks “Book a Demo” is eager and wants a salesperson to sell to them.
Also, if you can enrich the data behind a sign-up, you might find out if the user can afford your product or service in the first place.
These tools help you determine if the user is from a 10,000-person company (that sales should call immediately) vs. a mom-and-pop shop that cannot purchase at an enterprise level.
That is what lead scoring is all about.
Here are some enrichment data with tools you may consider:
CRM Integration Stage
The next data collection stage for your SaaS metric is client retention management software or CRM integration.
The objective is to track prospects through the process of buying.
The steps for converting SaaS product users look like this:
- Pull prospects in to use your product.
- Convert users.
- Go through user onboarding.
- Users need to love your product.
If you don't outline these steps and qualify the users leading up to them, you’re leaving money on the table.
Some CRMs are:
Integrate With a Dashboard
SaaS dashboards consolidate and visualize key metrics that help develop an overview of your company’s progress.
The sample dashboard below is customized with key SaaS metrics such as units sold, average sales, social following, and more.
To demonstrate the usefulness of dashboard integration from start to finish, here’s an example:
- Google Tag Manager helps track every action on a SaaS website, including the sources.
- All the information from analytics is sent via segment over to a database, which follows the lead into the CRM.
- Once a user converts on the online form, additional data is received and compiled in a database along with data from the online form.
- A tool is used to enrich the data and then perfect data is inside the CRM.
This information is robust and helps predict recurring revenue.
User Journey Mapping Stage
Building a user journey map is a must for large companies and startups.
The process involves mapping out all the steps a user takes to become a paying customer that completes your sales cycle.
Work backward from the end of the customer cycle to the beginning. Ask yourself:
- Where did users come from?
- What did they do?
- What’s the least amount of steps to get there?
- How do I do this for other users?
Here are some tools to help answer the customer cycle questions above:
Try reducing time-to-value through straight-line onboarding if your user journey map has too many steps.
Measuring Behavior Stage
What happens after a user has converted and is inside your platform?
Like Google Analytics, tools can track every user’s action, such as clicks, invites, and mobile app swipes, as soon as they log into the platform.
Tools that track user behavior include:
Tracking tools provide an entire field of data to organize and analyze.
The next step is to ask yourself:
- What pathway is the most successful?
- What do all of these users have in common?
- What do my best-paying users have in common?
After analyzing behavior, you can start to channel all users to perform the same actions as your best-paying ones.
For example, if most paying customers input their credit card after performing a specific action, encourage all users to do that.
In-app messaging to emails encourages users to take desirable action on your platform. Fortunately, different tools can help:
Onboarding
SaaS companies generally have a few seconds to engage a user, and minor adjustments make significant differences in onboarding.
Pull the user in through the entire experience.
Effective onboarding includes:
- Personalized Content
- Hyper Intuitive Steps
- Short Descriptions
- Mix Mediums
A SaaS company can spice up its onboarding, for example, with a small pop-up window or section that automatically plays a video without audio.
Record these videos in a matter of seconds using a microphone and a screen capture tool. Screen-capture tools are a dime a dozen, so pick whichever one you like. Loom is a free option.
Reporting
Let’s touch quickly on reporting because you miss so much by not having it.
Tools that show where users come from, their most successful campaigns, and the most successful actions are powerful. Seeing the number of people who use a product daily, weekly, monthly, or quarterly means you own the entire system.
By tracking customer churn rate and customer conversion rate, for example, your company can pinpoint areas of weakness and find solutions. Typically, SaaS companies report anywhere from 5-7% customer churn rates, so you’ll know when you need to re-evaluate.
Tools that do this are:
Having that amount of data on hand is the difference between companies that can scale and those that can’t.
Next, we’ll look at retention.
Retention
A report from SaaS Capital found that a $2 million SaaS company needs to grow more than 90% year-over-year. Reducing the customer churn rate to retain users is crucial for business longevity.
Small retention hacks make a big difference.
Three actions to help retention include:
#1. User Appreciation
A thank you card, loyalty program, gifts on anniversaries, candy, cookies, tickets to events, and special discounts to let users know you value their business.
For contracts carrying 30% or more of your business, make sure it’s apparent through more grand gestures that you’re thrilled to have them on board.
#2. Gamify
Using SaaS dashboards to gamify and monitor activity is valuable to the user and helps SaaS companies track data on key user metrics.
An example is a fitness app, where points are rewarded and detracted based on activity level.
#3. Add Emotion
Integrating emotion into your UX to retain users.
TunnelBear adds emotion when users opt out of its VPN service. When you uninstall the software, the bear starts to cry and says, “I thought we were friends.”
The uninstall progress tracker reads, “Removing bear fur from hard drive, drying bear tears, buffing claw marks off the motherboard, and bear’s girlfriend stops calling.”
TunnelBear reported that 10% of people reinstalled it because a cartoon bear cried.
FAQs About SaaS Metrics
What is the most important metric for measuring the success of a startup SaaS company and why?
The most important metric for measuring the success of a start-up SaaS company might be monthly recurring revenue, customer churn rate, acquisition cost, or customer conversion rate. Every startup deals with unique industry circumstances, so “the most important” metric varies. SaaS companies involve a lot of investment upfront, so you’ll want to pinpoint metrics that help make your business sustainable as fast as possible.
What are key metrics of importance for a B2B SaaS sales pipeline?
Important metrics to track for a B2B SaaS sales pipeline include (but are not limited to) customer acquisition cost, conversion rate, monthly active users, customer lifetime value, and monthly recurring revenue. These key metrics for every team in a product-led company help align Marketing and Sales teams to identify opportunities to generate revenue.
What are the most important metrics for a product manager in SaaS?
The most important metrics for a product manager in SaaS are customer churn, trial-to-paid conversion rate, net promoter score, number of user actions per session, time to value, and onboarding engagement rate.
What SaaS business metrics do CEOs care about most?
The SaaS business metrics that CEOs care most about include customer lifetime value, customer acquisition cost, annual recurring revenue, and product-qualified leads. CEOs tend to focus on cash flow and significant business picture metrics.
What engagement metrics will investors want to see when evaluating our SaaS start-up?
When assessing a SaaS startup, investors want to see engagement metrics such as activation rate, stickiness, core action use, product adoption percentage, and net promoter score.
How Will You Scale Your Business Quickly?
Gathering as much data as possible can make better decisions on which users to focus. If you learn how customers behave on your site, you can target them accordingly to scale your business quickly. Learn more product-led growth strategies to boost your SaaS business metrics by signing up for our free PLG fundamentals course.

