In the simplest of terms, product analytics is the process used to understand how customers engage with your product.
And the right framework allows you to focus your efforts on creating powerful experiences, identifying new opportunities, and analyzing behavioral data to better understand your audience.
Additionally, a product analytics framework allows you to do the following:
- Track and analyze behavioral data in real-time.
- Use the data to optimize the customer journey.
- Improve customer loyalty.
Before we go any further, I want to note that there’s no right or wrong way to create a product analytics framework. What works for you may not work for the next company and vice versa. Your objective is to implement a framework for collecting and analyzing data to improve the customer journey.
What is a product analytics framework?
Product analytics is a process that allows you to understand how customers engage with your product. With this framework, you put your customers at the core of your business by analyzing behavioral data and using your findings to identify new opportunities and create a more impactful experience.
A product analytics framework also allows you to track, visualize, and analyze real-time behavioral data and engagement to optimize the journey from prospect to customer.
What you’ll learn from a product analytics framework
A product analytics framework provides access to unique insights not found through other forms of analytics, such as sales or marketing-related analytics. You can use this type of framework to learn:
- How your app is used
- Which features are commonly used and commonly ignored
- Top marketing channels for driving trials and paid customers
- The number of returning users (daily, weekly, monthly)
- The traits of your most engaged users
This data can then be used across your company — from product management to design to sales and marketing — to improve the product, drive engagement, and ultimately increase revenue.
Building off the above, there are several different analyses your SaaS company can obtain through an analytics framework.
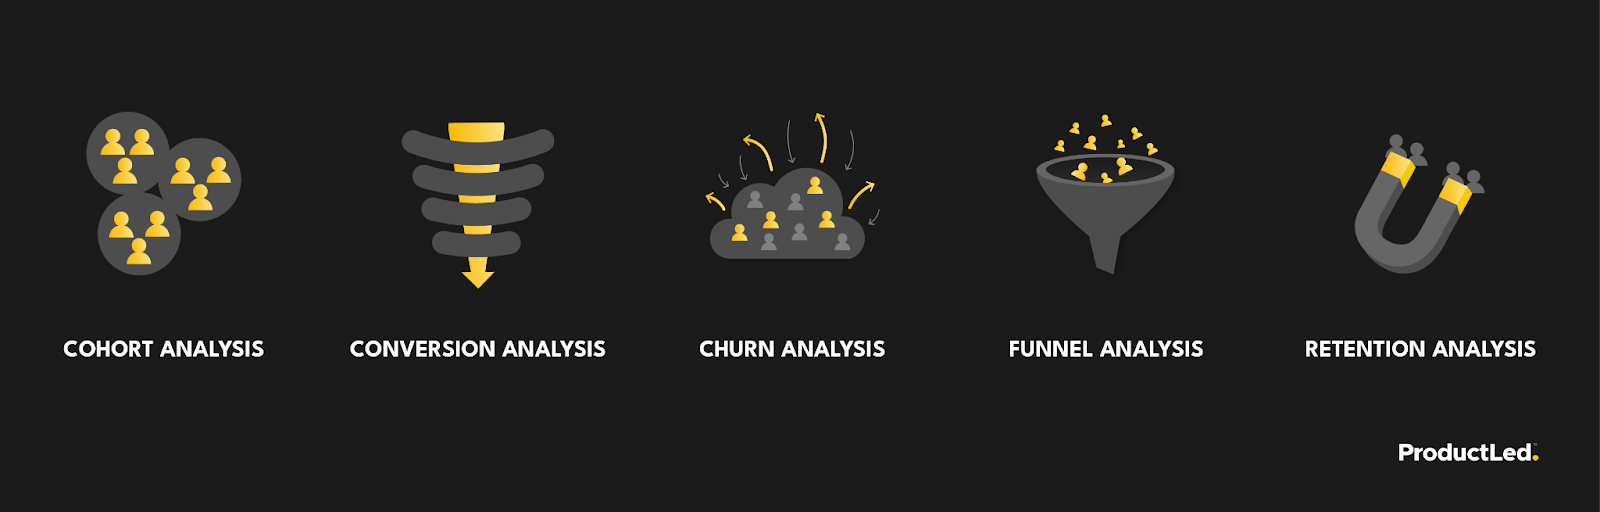
Cohort analysis
Cohort analysis allows you to segment users into smaller groups with common characteristics. A common example is grouping users based on their interaction with your product since signing up.
Conversion analysis
Which users have completed every stage of your funnel? Which ones did not convert? This type of analysis helps you uncover insights that you can use to convert more free users in the future.
Churn analysis
It’s one thing to know that you have a high churn rate. It’s another thing to address it. That’s where a churn analysis can help. Product analytics shows you who is sticking with your product, who isn’t, and when/how they’re disengaging.
Funnel analysis
Funnel analysis provides a visual overview of how users move through a series of steps, allowing you to pinpoint roadblocks and where users are leaving your onboarding process.
Retention analysis
Use this analysis to understand how many customers return to your product over a specified period of time. When combined with cohort analysis, you can uncover the behaviors contributing to retention (or a lack thereof).
The importance of timely activation in a product analytics framework
The more you experiment with a product analytics framework the more you’ll understand what does and doesn’t work for your business. However, I’ve found that timely activation is one of the most important details.
There’s some gray area here in which activation occurs (more on this below), but activation must occur within a reasonable amount of time. It’s your job to decide what “reasonable” means in the context of your product analytics framework. This leads to various questions such as:
- Is the metric easily achieved by most users?
- Can the metric be completed quickly and efficiently?
Generally, I consider a timely activation to be somewhere in the seven to 28-day range. With this, there’s a much greater chance of long-term retention. When I look at this metric alongside people who’ve churned and people who remain customers, there’s almost always a massive difference. Those who are quick to activate are more likely to remain a customer.
But don’t stop there.
You can take the same approach with almost any data point or feature. For example, based on the product, take a detailed look at the top 10 metrics and/or features and how quickly they’re activated. The most important questions to answer include:
- Are greater than 50 percent of users reaching your activation goals?
- How quickly are they activating?
- Does their speed correlate to churn?
- Does it correlate to conversion?
Those are the four questions that I ask for every single metric. Typically, the answers to these questions separate things quickly because most people don’t fully use your product. Most features don’t make it past the first question.
The most common mistakes
Even with a defined framework, there’s still the possibility of making a mistake (or several mistakes). This is often related to the process of deciding what the activation metric truly is.
The top mistake is making the decision too complicated. For instance, too many people get excited about health scoring.
Health scoring is nothing more than a blended score from several touchpoints. On the surface, it sounds promising. However, there’s something you’re missing: the inefficiencies of explaining health scoring to a salesperson, marketing person, or customer service representative among others.
A CEO or other high-level executive doesn’t care about a health score. They care about defined data that’s attached to results. Don’t overcomplicate it. Make it simple so that you, and everyone else, can understand it.
Another common mistake with activation metrics is neglecting to confirm that your findings are accurate. You must constantly review data, answer questions, and confirm that it’s accurate at the present time:
- Is it truly having an impact on your business?
- Is it having the same impact as it always has?
You’re going to make mistakes when building out a product analytics framework. The same holds true for activation metrics. It’s okay to make mistakes as long as you know what led you down this path and take steps to avoid the same in the future.
Achieve success with a laser focus
It’s easy to believe that you can make massive changes overnight – this line of thinking has the potential to bog you down over the long run. When results don’t pour in right away, you’ll find yourself wondering if you’re on the right path. And that can lead you to jump ship before you gather all the necessary data.
There are many levers that make a PLG business a success, but you can’t focus on all of them at the same time. This brings us back to the point above about focusing heavily on activation metrics above all others.
There’s one question to answer: how long does it take for activation to occur?
Focus on this — until you figure it out — and leave everything else alone.
Think about it like this. If your one-year goal is to create an industry-leading onboarding experience, you’re likely to run into many hiccups along the way. Not only can these slow you down, but they can push you down the wrong path.
The better approach is to break down your goal into bite-size pieces. This can be as simple as focusing on one type of product metric, such as activation.
You don’t have to adopt every feature of a product-led business on day one. For example, you may find that 75 percent of your business is sales-led in the first six months. That’s okay. You’re making sales and you’re learning what does and doesn’t work. You have a foundation on which to grow the product-led side of your organization over the next six months.
Find what’s going to have the biggest impact on your business and then chase product-led growth by focusing most of your attention and resources on it.
What comes next for your company?
By now, you understand how a product analytics framework, along with a focus on activation metrics, can help you build a successful PLG company. Now, it’s time to put this knowledge to good use.
In our four-week ProductLed Accelerator program, we provide all the tools you need to launch a product-led growth strategy that fits your product. Even if your product is already in the marketplace, we can help identify the areas you can experiment on to increase market adoption.
Boomi, a $4 billion integration platform, transitioned to a product-led go-to-market strategy using our framework. Here’s what they had to say about the ProductLed Accelerator:
The course is so comprehensive and the ideal training tool for a newly established product-led culture. It helped us create a shared language.
When you sign up for the ProductLed Accelerator program, you get:
- Full access to the 4-week live online program for 60 days that covers the steps to implement product-led growth.
- Unlimited 1:1 feedback for 60 Days via Slack with ProductLed Coaches for concrete feedback.
- Private Slack community for class discussions with your cohort.
- Frameworks and templates that help you apply the training to your bsiness.
Take our free PLG certification course now or sign up for our next live training program. You can also get your questions answered by peers and experts when you join the world’s largest product-led growth community on Slack.